|

USD/CAD Price Analysis: Double-top emerges, targeting 1.2930

  • USD/CAD prepares to finish the week with decent losses of 0.27%.
  • Failure at around 1.3200 spurred a double-top formation in the USD/CAD daily chart, which targets 1.2930.
  • The USD/CAD in the near term is also downward biased.

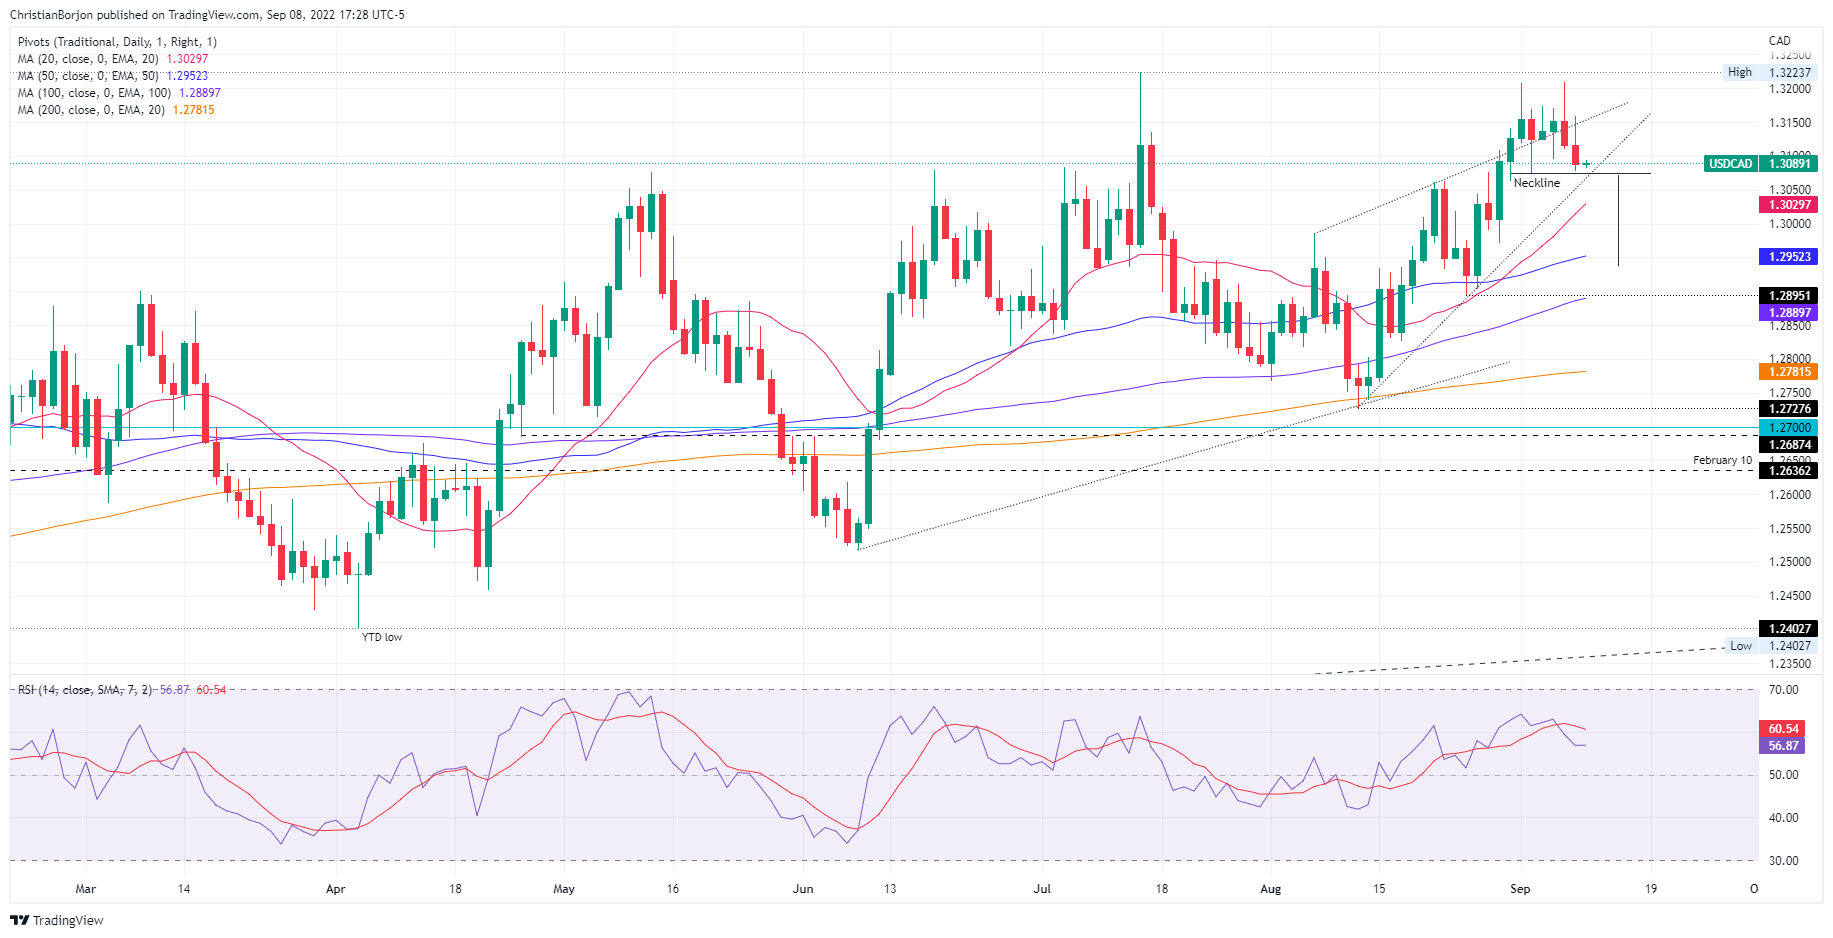
The USD/CAD slides for the second consecutive day, tumbling to fresh weekly lows at around 1.3077, after failing to break the YTD high at 1.3227 twice in September. At the time of writing, the USD/CAD is trading at 1.3089, above its opening price, as the Asian Pacific session begins.

USD/CAD Price Analysis: Technical outlook

The USD/CAD daily chart indicates the pair is neutral-upwards biased. Nevertheless, price action during the last seven days witnessed a double-top formation, meaning that downside risks remain. Therefore, the USD/CAD first support would be the neckline at around 1.3074. A break below will expose an upslope trendline that passes around 1.3060, followed by the 20-day EMA at 1.3029. Once cleared, the next demand zone would be the 50-day EMA at 1.2952, followed by the double-top target at 1.2930.

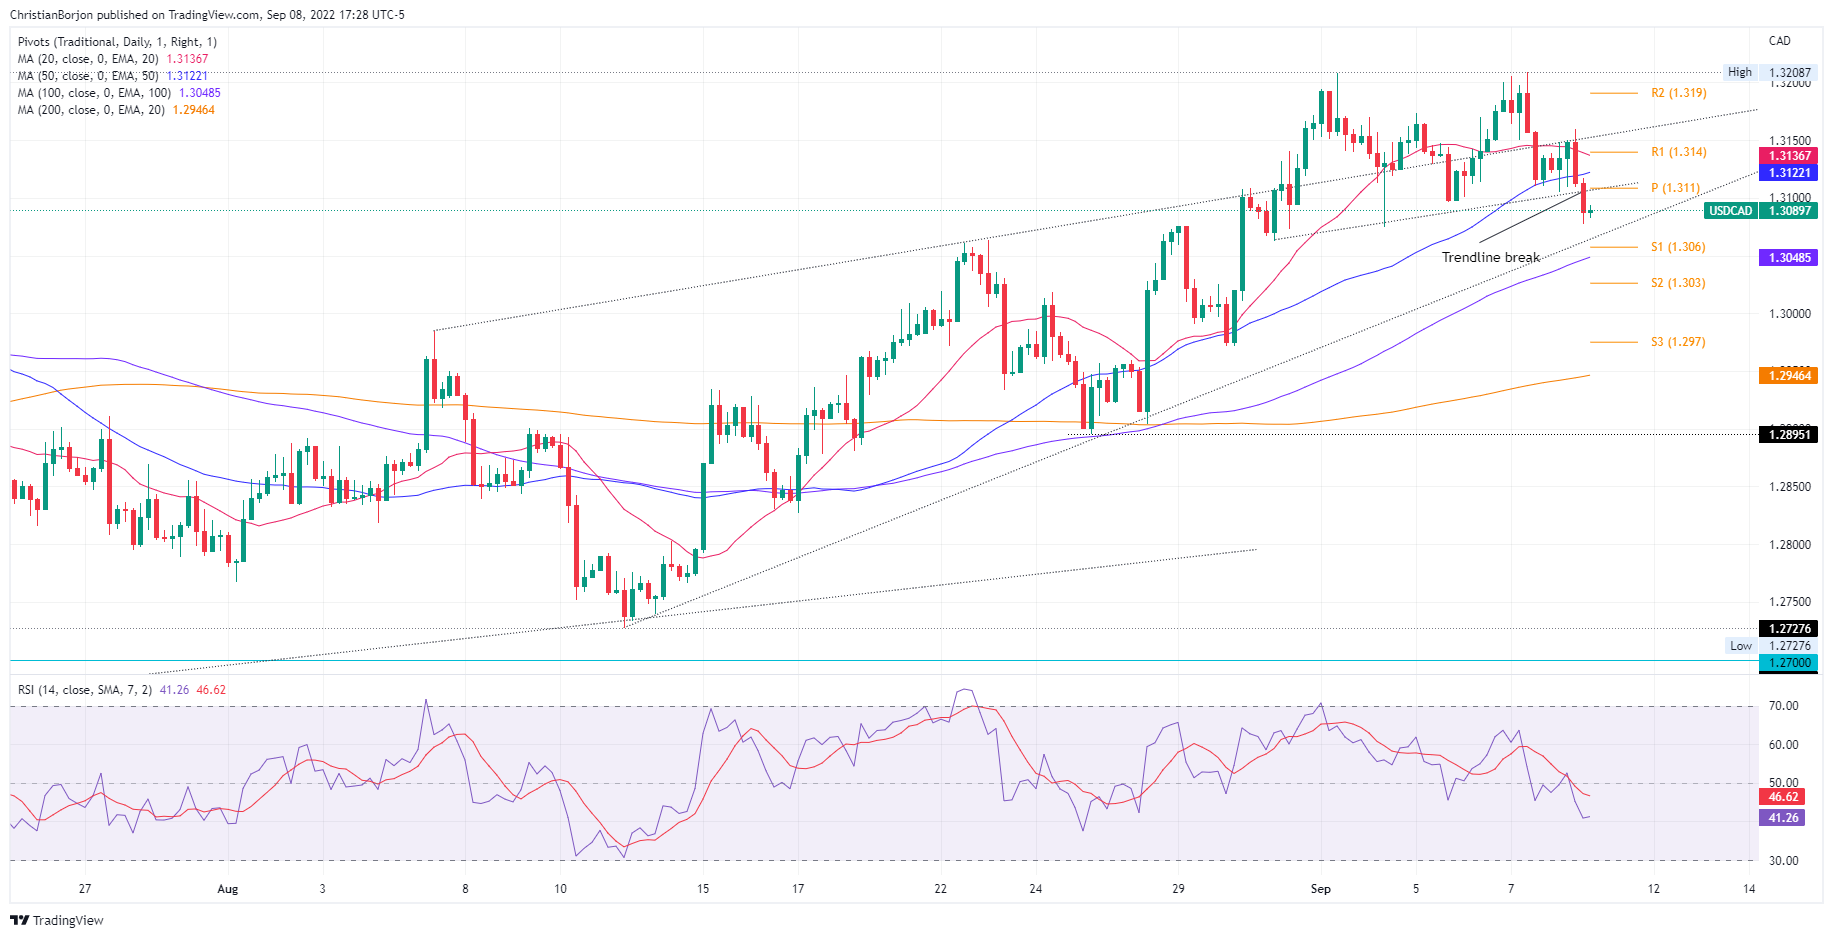
Short term, the USD/CAD 4-hour chart depicts a trendline break, which also confluences with Friday’s daily pivot point at around 1.3110. However, a break below 1.3077 would exacerbate a move towards the confluence of the S1 daily pivot and the 100-EMA around 1.3048-60, which, once cleared, would pave the way towards the S2 pivot point at 1.3037, followed by the S3 daily pivot at 1.2975.

USD/CAD Key Technical Levels

USD/CAD

Overview
Today last price1.3089
Today Daily Change-0.0034
Today Daily Change %-0.26
Today daily open1.3123
 
Trends
Daily SMA201.3002
Daily SMA501.2948
Daily SMA1001.2884
Daily SMA2001.2782
 
Levels
Previous Daily High1.3209
Previous Daily Low1.3111
Previous Weekly High1.3208
Previous Weekly Low1.2972
Previous Monthly High1.3141
Previous Monthly Low1.2728
Daily Fibonacci 38.2%1.3148
Daily Fibonacci 61.8%1.3171
Daily Pivot Point S11.3086
Daily Pivot Point S21.3049
Daily Pivot Point S31.2988
Daily Pivot Point R11.3184
Daily Pivot Point R21.3246
Daily Pivot Point R31.3282

Author

Christian Borjon Valencia

Markets analyst, news editor, and trading instructor with over 14 years of experience across FX, commodities, US equity indices, and global macro markets.

More from Christian Borjon Valencia
Share:

Editor's Picks

EUR/USD looks sidelined around 1.1850

EUR/USD remains on the back foot, extending its bearish tone and sliding towards the 1.1850 area to print fresh daily lows on Monday. The move lower comes as the US Dollar gathers modest traction, with thin liquidity and subdued volatility amplifying price swings amid the US market holiday.

GBP/USD flirts with daily lows near 1.3630

GBP/USD has quickly given back Friday’s solid gains, turning lower at the start of the week and drifting back towards the 1.3630 area. The focus now shifts squarely to Tuesday’s UK labour market report, which is likely to keep the quid firmly in the spotlight and could set the tone for Cable’s next move.

Gold loses momentum, eases below $5,000

Gold is giving back part of Friday’s sharp rebound, deflating below the key $5,000 mark per troy ounce as the new week gets underway. Modest gains in the US Dollar are keeping the metal in check, while thin trading conditions, due to the Presidents Day holiday in the US, are adding to the choppy and hesitant tone across markets.

Bitcoin consolidates as on-chain data show mixed signals

Bitcoin price has consolidated between $65,700 and $72,000 over the past nine days, with no clear directional bias. US-listed spot ETFs recorded a $359.91 million weekly outflow, marking the fourth consecutive week of withdrawals.

The week ahead: Key inflation readings and why the AI trade could be overdone

It is likely to be a quiet start to the week, with US markets closed on Monday for Presidents Day. European markets are higher across the board and gold is clinging to the $5,000 level after the tamer than expected CPI report in the US reduced haven flows to precious metals.

XRP steadies in narrow range as fund inflows, futures interest rise

Ripple is trading in a narrow range between $1.45 (immediate support) and $1.50 (resistance) at the time of writing on Monday. The remittance token extended its recovery last week, peaking at $1.67 on Sunday from the weekly open at $1.43.