USD/CAD Price Analysis: Cushion around 1.3700 looks delicate ahead of Canada CPI and Fed policy


  • USD/CAD is expressing volatility contraction ahead of Fed inflation and Canada’s inflation.
  • The USD Index has corrected further to 103.65 as the Fed is expected to go light on interest rates.
  • A 40.00-60.00 range oscillation by the RSI (14) indicates that investors are awaiting a fresh trigger for further action.

The USD/CAD pair has found a cushion around 1.3700 after a marginal correction in the Asian session. The Loonie asset is showing an expression of volatility contraction as investors are awaiting the release of Canada’s Consumer Price Index (CPI) data and the interest rate decision by the Federal Reserve (Fed), which will release on Tuesday and Wednesday respectively.

The option for an unchanged monetary policy decision by the Federal Reserve (Fed) is gaining the limelight as banking shakedown in the United States has impacted the confidence of investors dramatically.

Meanwhile, the US Dollar Index (DXY) has corrected further to 103.65 as the Fed is expected to go light on interest rates. S&P500 futures have shown a recovery move after a bearish Friday’s settlement, however, investors’ risk appetite for US equities is extremely weak.

On the Canadian Dollar front, investors are awaiting Tuesday’s Canada inflation data. As per the consensus, the headline Consumer Price Index (CPI) is expected to accelerate by 0.4%, lower than the former release of 0.5%. This might drag the annual headline CPI further to 5.5%. Also, the annual core CPI is expected to trim to 4.6% from the former release of 5.0%.

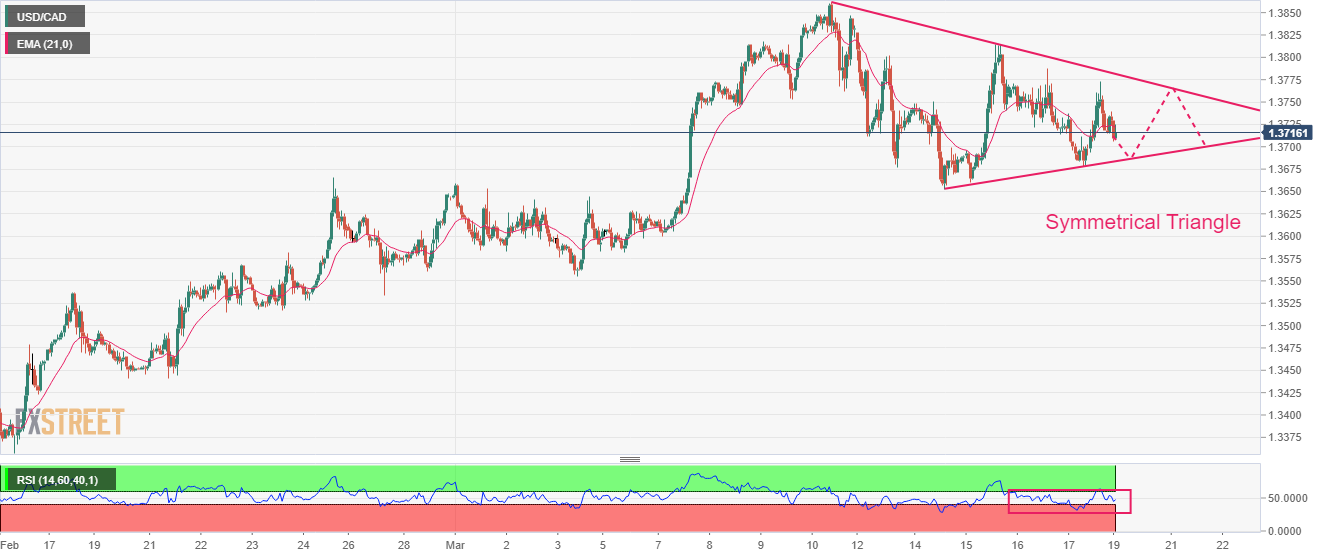
USD/CAD is auctioning in a Symmetrical Triangle chart pattern on an hourly scale, which indicates a sheer volatility contraction followed by an expansion in the same. The downward-sloping trendline of the chart pattern is plotted from March 10 high at 1.3862 while the upward-sloping trendline is placed from March 14 low at 1.3657.

Overlapping 20-period Exponential Moving Average (EMA) at 1.3724 with the asset price indicates a consolidation ahead.

Adding to that, a 40.00-60.00 range oscillation by the Relative Strength Index (RSI) (14) indicates that investors are awaiting a new trigger for further action.

A decisive breakdown of March 14 low at 1.3652 would drag the loonie asset toward March 07 low at 1.3600, followed by March 03 low at 1.3555.

In an alternate scenario, a confident recovery above March 14 high at 1.3773 would drive the major toward March 09 high at 1.3835 and the round-level resistance at 1.3900.

USD/CAD hourly chart

USD/CAD

Overview
Today last price 1.3717
Today Daily Change -0.0012
Today Daily Change % -0.09
Today daily open 1.3729
 
Trends
Daily SMA20 1.3658
Daily SMA50 1.3497
Daily SMA100 1.351
Daily SMA200 1.334
 
Levels
Previous Daily High 1.3773
Previous Daily Low 1.3678
Previous Weekly High 1.3828
Previous Weekly Low 1.3652
Previous Monthly High 1.3666
Previous Monthly Low 1.3262
Daily Fibonacci 38.2% 1.3737
Daily Fibonacci 61.8% 1.3714
Daily Pivot Point S1 1.368
Daily Pivot Point S2 1.3631
Daily Pivot Point S3 1.3585
Daily Pivot Point R1 1.3776
Daily Pivot Point R2 1.3822
Daily Pivot Point R3 1.3872


Share: Feed news

Information on these pages contains forward-looking statements that involve risks and uncertainties. Markets and instruments profiled on this page are for informational purposes only and should not in any way come across as a recommendation to buy or sell in these assets. You should do your own thorough research before making any investment decisions. FXStreet does not in any way guarantee that this information is free from mistakes, errors, or material misstatements. It also does not guarantee that this information is of a timely nature. Investing in Open Markets involves a great deal of risk, including the loss of all or a portion of your investment, as well as emotional distress. All risks, losses and costs associated with investing, including total loss of principal, are your responsibility. The views and opinions expressed in this article are those of the authors and do not necessarily reflect the official policy or position of FXStreet nor its advertisers. The author will not be held responsible for information that is found at the end of links posted on this page.

If not otherwise explicitly mentioned in the body of the article, at the time of writing, the author has no position in any stock mentioned in this article and no business relationship with any company mentioned. The author has not received compensation for writing this article, other than from FXStreet.

FXStreet and the author do not provide personalized recommendations. The author makes no representations as to the accuracy, completeness, or suitability of this information. FXStreet and the author will not be liable for any errors, omissions or any losses, injuries or damages arising from this information and its display or use. Errors and omissions excepted.

The author and FXStreet are not registered investment advisors and nothing in this article is intended to be investment advice.

Recommended content


Recommended content

Editors’ Picks

AUD/USD remained bid above 0.6500

AUD/USD remained bid above 0.6500

AUD/USD extended further its bullish performance, advancing for the fourth session in a row on Thursday, although a sustainable breakout of the key 200-day SMA at 0.6526 still remain elusive.

AUD/USD News

EUR/USD faces a minor resistance near at 1.0750

EUR/USD faces a minor resistance near at 1.0750

EUR/USD quickly left behind Wednesday’s small downtick and resumed its uptrend north of 1.0700 the figure, always on the back of the persistent sell-off in the US Dollar ahead of key PCE data on Friday.

EUR/USD News

Gold holds around $2,330 after dismal US data

Gold holds around $2,330 after dismal US data

Gold fell below $2,320 in the early American session as US yields shot higher after the data showed a significant increase in the US GDP price deflator in Q1. With safe-haven flows dominating the markets, however, XAU/USD reversed its direction and rose above $2,340.

Gold News

Bitcoin price continues to get rejected from $65K resistance as SEC delays decision on spot BTC ETF options

Bitcoin price continues to get rejected from $65K resistance as SEC delays decision on spot BTC ETF options

Bitcoin (BTC) price has markets in disarray, provoking a broader market crash as it slumped to the $62,000 range on Thursday. Meanwhile, reverberations from spot BTC exchange-traded funds (ETFs) continue to influence the market.

Read more

US economy: slower growth with stronger inflation

US economy: slower growth with stronger inflation

The dollar strengthened, and stocks fell after statistical data from the US. The focus was on the preliminary estimate of GDP for the first quarter. Annualised quarterly growth came in at just 1.6%, down from the 2.5% and 3.4% previously forecast.

Read more

Forex MAJORS

Cryptocurrencies

Signatures