USD/CAD Price Analysis: Buyers stepped in around weekly lows on risk aversion
- The US Dollar stages a recovery on risk aversion spurred by the China Covid-19 crisis.
- USD/CAD bounced off weekly lows around 1.3300 and tested the 1.3400 mark.
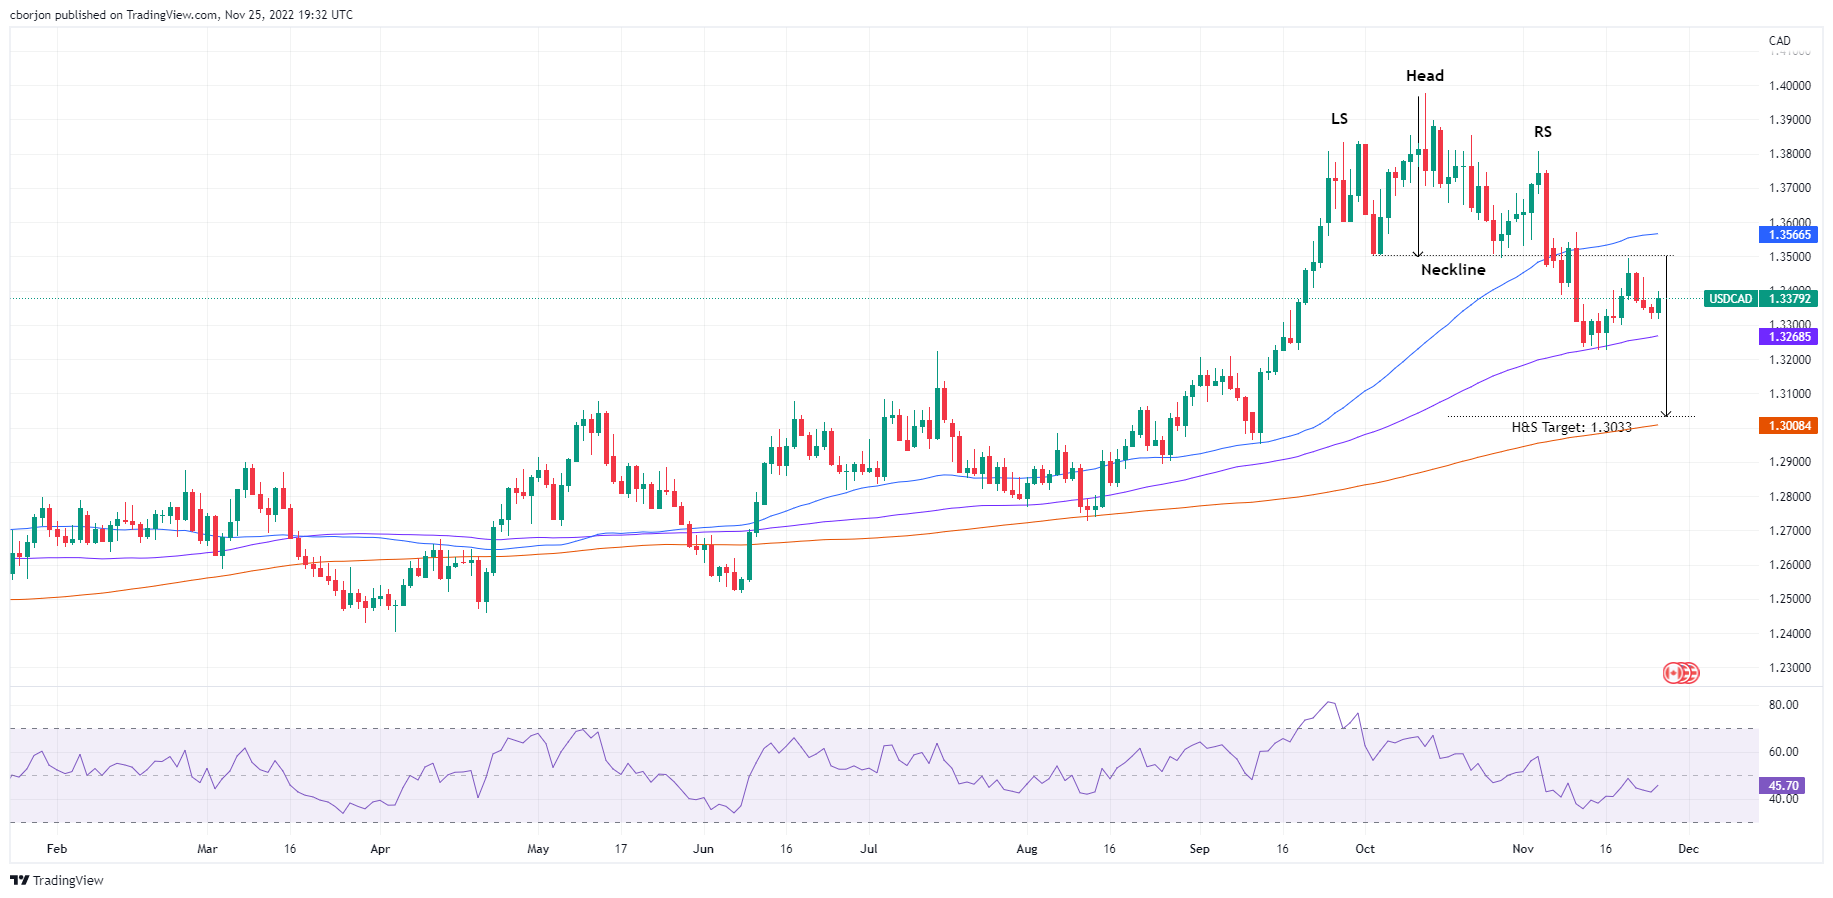
- USD/CAD Price Analysis: The head-and-shoulders chart pattern remains intact.

The US Dollar (USD) stages a recovery against the Canadian Dollar (CAD) amid a subdued trading session sparked by thin liquidity conditions caused by the observance of the US Thanksgiving holiday. However, China’s Covid-19 cases jumping above 30,000 spurring a risk-off impulse, and US Treasury yields rising, underpinned the USD. At the time of writing, the USD/CAD is trading at 1.3376
USD/CAD Price Analysis: Technical outlook
Delving into the USD/CAD daily chart, the major erased Thursday’s losses, though it faltered to crack the 1.3400 figure after reaching a daily high of 1.3398. Although the US Dollar is buoyant, traders should know that the head-and-shoulders chart pattern is still in play. However, the USD/CAD needs to tumble below 1.3300 and the 100-day Exponential Moving Average (EMA) at 1.3268 to exacerbate a fall toward the head-and-shoulders chart pattern. Otherwise, the USD/CAD might jump above the 1.3500 neckline and invalidate the pattern.
As an alternate scenario, the USD/CAD first resistance would be the 1.3400 figure. A breach of the latter will send the USD/CAD climbing toward the confluence of the head-and-shoulders neckline and the 1.3500 psychological level, followed by the 50-day Exponential Moving Average (EMA) at 1.3566.
USD/CAD Key Technical Levels
Author

Christian Borjon Valencia
FXStreet
Markets analyst, news editor, and trading instructor with over 14 years of experience across FX, commodities, US equity indices, and global macro markets.

















