USD/CAD Price Analysis: Bulls moved in, reaches two-day high as a bullish-engulfing pattern looms


  • Bullish-engulfing candlestick pattern on the daily chart suggests buyers are in control.
  • The first major resistance at 1.3600, followed by several key levels up to 1.3804.
  • Downside risks include a drop below 1.3489, potentially targeting the 200-DMA at 1.3462 and the 50-DMA at 1.3345.

The Canadian Dollar (CAD) losses ground against the US Dollar (USD) sponsored on weaker than expected Canadian economic growth in the second quarter, alongside a mixed US jobs report and improvements in business activity. Hence, the USD/CAD is trading at 1.3595 after hitting a daily low of 1.3489, above its opening price by 0.65%.

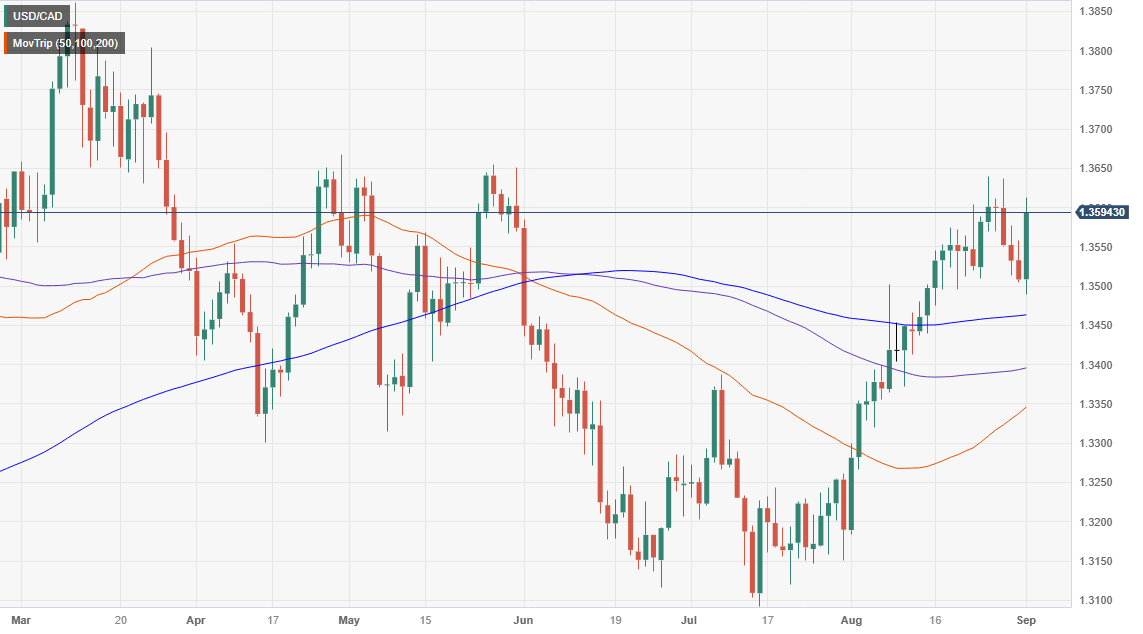
USD/CAD Price Analysis: Technical outlook

The daily chart portrays the pair as neutral to upward biased, though the major reached a lower low at 1.3489, slightly below the August 8 daily high at 1.3502. However, the USD/CAD recovery was outstanding, forming a bullish-engulfing candlestick chart pattern, which engulfed the price action of the previous two days. Hence, buyers are in charge.

The USD/CAD first resistance would be the 1.3600 figure. A breach of the latter will expose the August 25 high at 1.3640, closely followed by the May 26 swing high at 1.3654 and the April 28 high at 1.3667. Once those levels are cleared, the 1.3700 figure would be up next before rallying towards the March 24 daily high at 1.3804.

Conversely, if the USD/CAD drops below 1.3489, the pair could shift downwards and extend its losses toward the 200-day Moving Average (DMA) at 1.3462. Once cleared, the next stop would be the psychological 1.3400 area, and up next, the 50-DMA at 1.3345.

USD/CAD Price Action – Hourly chart

USD/CAD

Overview
Today last price 1.3594
Today Daily Change 0.0085
Today Daily Change % 0.63
Today daily open 1.3509
 
Trends
Daily SMA20 1.3503
Daily SMA50 1.3338
Daily SMA100 1.3394
Daily SMA200 1.3462
 
Levels
Previous Daily High 1.3558
Previous Daily Low 1.3504
Previous Weekly High 1.364
Previous Weekly Low 1.3496
Previous Monthly High 1.364
Previous Monthly Low 1.3184
Daily Fibonacci 38.2% 1.3525
Daily Fibonacci 61.8% 1.3537
Daily Pivot Point S1 1.3489
Daily Pivot Point S2 1.347
Daily Pivot Point S3 1.3436
Daily Pivot Point R1 1.3543
Daily Pivot Point R2 1.3577
Daily Pivot Point R3 1.3596


Share: Feed news

Information on these pages contains forward-looking statements that involve risks and uncertainties. Markets and instruments profiled on this page are for informational purposes only and should not in any way come across as a recommendation to buy or sell in these assets. You should do your own thorough research before making any investment decisions. FXStreet does not in any way guarantee that this information is free from mistakes, errors, or material misstatements. It also does not guarantee that this information is of a timely nature. Investing in Open Markets involves a great deal of risk, including the loss of all or a portion of your investment, as well as emotional distress. All risks, losses and costs associated with investing, including total loss of principal, are your responsibility. The views and opinions expressed in this article are those of the authors and do not necessarily reflect the official policy or position of FXStreet nor its advertisers. The author will not be held responsible for information that is found at the end of links posted on this page.

If not otherwise explicitly mentioned in the body of the article, at the time of writing, the author has no position in any stock mentioned in this article and no business relationship with any company mentioned. The author has not received compensation for writing this article, other than from FXStreet.

FXStreet and the author do not provide personalized recommendations. The author makes no representations as to the accuracy, completeness, or suitability of this information. FXStreet and the author will not be liable for any errors, omissions or any losses, injuries or damages arising from this information and its display or use. Errors and omissions excepted.

The author and FXStreet are not registered investment advisors and nothing in this article is intended to be investment advice.

Recommended content


Recommended content

Editors’ Picks

AUD/USD picks up fresh bids toward 0.6450 on renewed US Dollar selling

AUD/USD picks up fresh bids toward 0.6450 on renewed US Dollar selling

AUD/USD catches fresh bids and tests 0.6450 early Wednesday. Renewed US Dollar weakness on trade tensions over China outweigh the RBA's dovish outlook and the domestic political turmoil, aiding the pair's fresh leg higher. Focus remains on tariff talks and Fedspeak. 

USD/JPY breaks below 144.00 amid unabated US Dollar supply

USD/JPY breaks below 144.00 amid unabated US Dollar supply

USD/JPY breaks below144.00 despite the disappointing release of Japan's trade balance data, as hawkish BoJ expectations continue to underpin the Japanese Yen. Meanwhile, the US Dollar extends losses amid Fed rate cut bets and a downgrade of the US government's credit rating, exerting additional pressure on the major.

Gold price awaits acceptance above $3,300 as buyers return

Gold price awaits acceptance above $3,300 as buyers return

Gold price is extending its upswing into the third consecutive day in Asian trading on Wednesday. Buyers look to regain the $3,300 on a sustained basis amid persistent US Dollar weakness and heightened geopolitical tensions.

UK CPI expected to reveal inflation rose in April, well above BoE’s goal

UK CPI expected to reveal inflation rose in April, well above BoE’s goal

The United Kingdom will release the Consumer Price Index (CPI) data for April on Wednesday at 06:00 GMT. The Inflation, as measured by the CPI, is foreseen to have risen by 1.1% on a monthly basis, much higher than the 0.3% posted in March. The annual figure is expected to be 3.3%, also higher than the previous 2.6%.

China April slowdown shows the impact of economic uncertainty

China April slowdown shows the impact of economic uncertainty

Trade war uncertainty is denting Chinese confidence, resulting in slower economic activity in April. Retail sales and fixed-asset investment both underperformed forecasts amid heightened caution. Yet the impact on manufacturing was less than feared.

The Best brokers to trade EUR/USD

The Best brokers to trade EUR/USD

SPONSORED Discover the top brokers for trading EUR/USD in 2025. Our list features brokers with competitive spreads, fast execution, and powerful platforms. Whether you're a beginner or an expert, find the right partner to navigate the dynamic Forex market.

Forex MAJORS

Cryptocurrencies

Signatures

Best Brokers of 2025