USD/CAD Price Analysis: Bulls looking to build on the recovery beyond 1.2800 mark


  • USD/CAD staged a modest recovery from a near two-month-old ascending channel support.
  • Bullish crude oil prices might underpin the loonie and cap any meaningful gains for the pair.
  • A convincing break below the 1.2770-65 area will set the stage for a further near-term slide.

The USD/CAD pair staged a goodish bounce from a one-and-half-week low touched earlier this Tuesday and climbed to the 1.2800 mark during the first half of the European session.

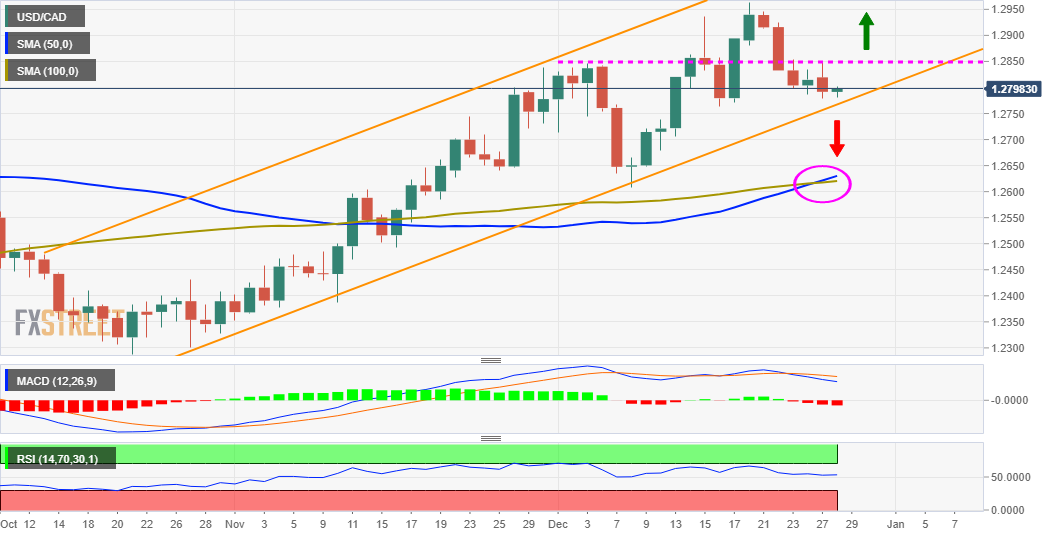
From a technical perspective, the recent corrective slide from the YTD low found a decent support near the lower boundary of an upward sloping channel extending from late October. The mentioned support is currently pegged near the 1.2770-65 region, which should now act as a pivotal point for short-term traders.

Meanwhile, technical indicators on the daily chart – though have been retreating from higher levels – are still holding in the positive territory. This, in turn, supports prospects for additional gains. That said, bullish crude oil prices might continue to underpin the commodity-linked loonie and cap the USD/CAD pair.

Hence, any subsequent positive move is more likely to confront stiff resistance near the 1.2845-50 supply zone. A sustained strength beyond will reinforce the constructive set-up and prompt some near-term short-covering rally. The USD/CAD pair could then aim back to reclaim the 1.2900 round-figure mark.

The momentum could get extended towards the recent daily closing high, near the 1.2935-40 area, en-route the YTD high, around the 1.2965 region. Some follow-through buying will be seen as a fresh trigger for bullish traders and has the potential to lift the USD/CAD pair towards the key 1.3000 psychological mark.

On the flip side, a convincing break below the trend-channel support, around the 1.2770-65 region, could prompt aggressive technical selling and accelerate the slide towards the 1.2710-1.2700 zone. The corrective fall could further get extended towards the 50/100-day SMAs confluence, currently around the 1.2625-15 region.

USD/CAD daily chart

fxsoriginal

Technical levels to watch

USD/CAD

Overview
Today last price 1.2799
Today Daily Change 0.0007
Today Daily Change % 0.05
Today daily open 1.2792
 
Trends
Daily SMA20 1.2802
Daily SMA50 1.2621
Daily SMA100 1.2618
Daily SMA200 1.2495
 
Levels
Previous Daily High 1.2848
Previous Daily Low 1.2779
Previous Weekly High 1.2964
Previous Weekly Low 1.2786
Previous Monthly High 1.2837
Previous Monthly Low 1.2352
Daily Fibonacci 38.2% 1.2805
Daily Fibonacci 61.8% 1.2822
Daily Pivot Point S1 1.2765
Daily Pivot Point S2 1.2738
Daily Pivot Point S3 1.2696
Daily Pivot Point R1 1.2833
Daily Pivot Point R2 1.2875
Daily Pivot Point R3 1.2902


Share: Feed news

Information on these pages contains forward-looking statements that involve risks and uncertainties. Markets and instruments profiled on this page are for informational purposes only and should not in any way come across as a recommendation to buy or sell in these assets. You should do your own thorough research before making any investment decisions. FXStreet does not in any way guarantee that this information is free from mistakes, errors, or material misstatements. It also does not guarantee that this information is of a timely nature. Investing in Open Markets involves a great deal of risk, including the loss of all or a portion of your investment, as well as emotional distress. All risks, losses and costs associated with investing, including total loss of principal, are your responsibility. The views and opinions expressed in this article are those of the authors and do not necessarily reflect the official policy or position of FXStreet nor its advertisers. The author will not be held responsible for information that is found at the end of links posted on this page.

If not otherwise explicitly mentioned in the body of the article, at the time of writing, the author has no position in any stock mentioned in this article and no business relationship with any company mentioned. The author has not received compensation for writing this article, other than from FXStreet.

FXStreet and the author do not provide personalized recommendations. The author makes no representations as to the accuracy, completeness, or suitability of this information. FXStreet and the author will not be liable for any errors, omissions or any losses, injuries or damages arising from this information and its display or use. Errors and omissions excepted.

The author and FXStreet are not registered investment advisors and nothing in this article is intended to be investment advice.

Recommended content


Recommended content

Editors’ Picks

AUD/USD posts gain, yet dive below 0.6500 amid Aussie CPI, ahead of US GDP

AUD/USD posts gain, yet dive below 0.6500 amid Aussie CPI, ahead of US GDP

The Aussie Dollar finished Wednesday’s session with decent gains of 0.15% against the US Dollar, yet it retreated from weekly highs of 0.6529, which it hit after a hotter-than-expected inflation report. As the Asian session begins, the AUD/USD trades around 0.6495.

AUD/USD News

USD/JPY finds its highest bids since 1990, approaches 156.00

USD/JPY finds its highest bids since 1990, approaches 156.00

USD/JPY broke into its highest chart territory since June of 1990 on Wednesday, peaking near 155.40 for the first time in 34 years as the Japanese Yen continues to tumble across the broad FX market. 

USD/JPY News

Gold stays firm amid higher US yields as traders await US GDP data

Gold stays firm amid higher US yields as traders await US GDP data

Gold recovers from recent losses, buoyed by market interest despite a stronger US Dollar and higher US Treasury yields. De-escalation of Middle East tensions contributed to increased market stability, denting the appetite for Gold buying.

Gold News

Ethereum suffers slight pullback, Hong Kong spot ETH ETFs to begin trading on April 30

Ethereum suffers slight pullback, Hong Kong spot ETH ETFs to begin trading on April 30

Ethereum suffered a brief decline on Wednesday afternoon despite increased accumulation from whales. This follows Ethereum restaking protocol Renzo restaked ETH crashing from its 1:1 peg with ETH and increased activities surrounding spot Ethereum ETFs.

Read more

Dow Jones Industrial Average hesitates on Wednesday as markets wait for key US data

Dow Jones Industrial Average hesitates on Wednesday as markets wait for key US data

The DJIA stumbled on Wednesday, falling from recent highs near 38,550.00 as investors ease off of Tuesday’s risk appetite. The index recovered as US data continues to vex financial markets that remain overwhelmingly focused on rate cuts from the US Fed.

Read more

Forex MAJORS

Cryptocurrencies

Signatures