USD/CAD Price Analysis: Bulls fail to take out the 12-month descending trendline

USD/CAD trades near 1.2633 at press time, representing a 0.14% drop on the day. The US Dollar is nursing moderate losses across the board with President Joe Biden on the verge of passing the record $1.9 trillion fiscal stimulus plan.
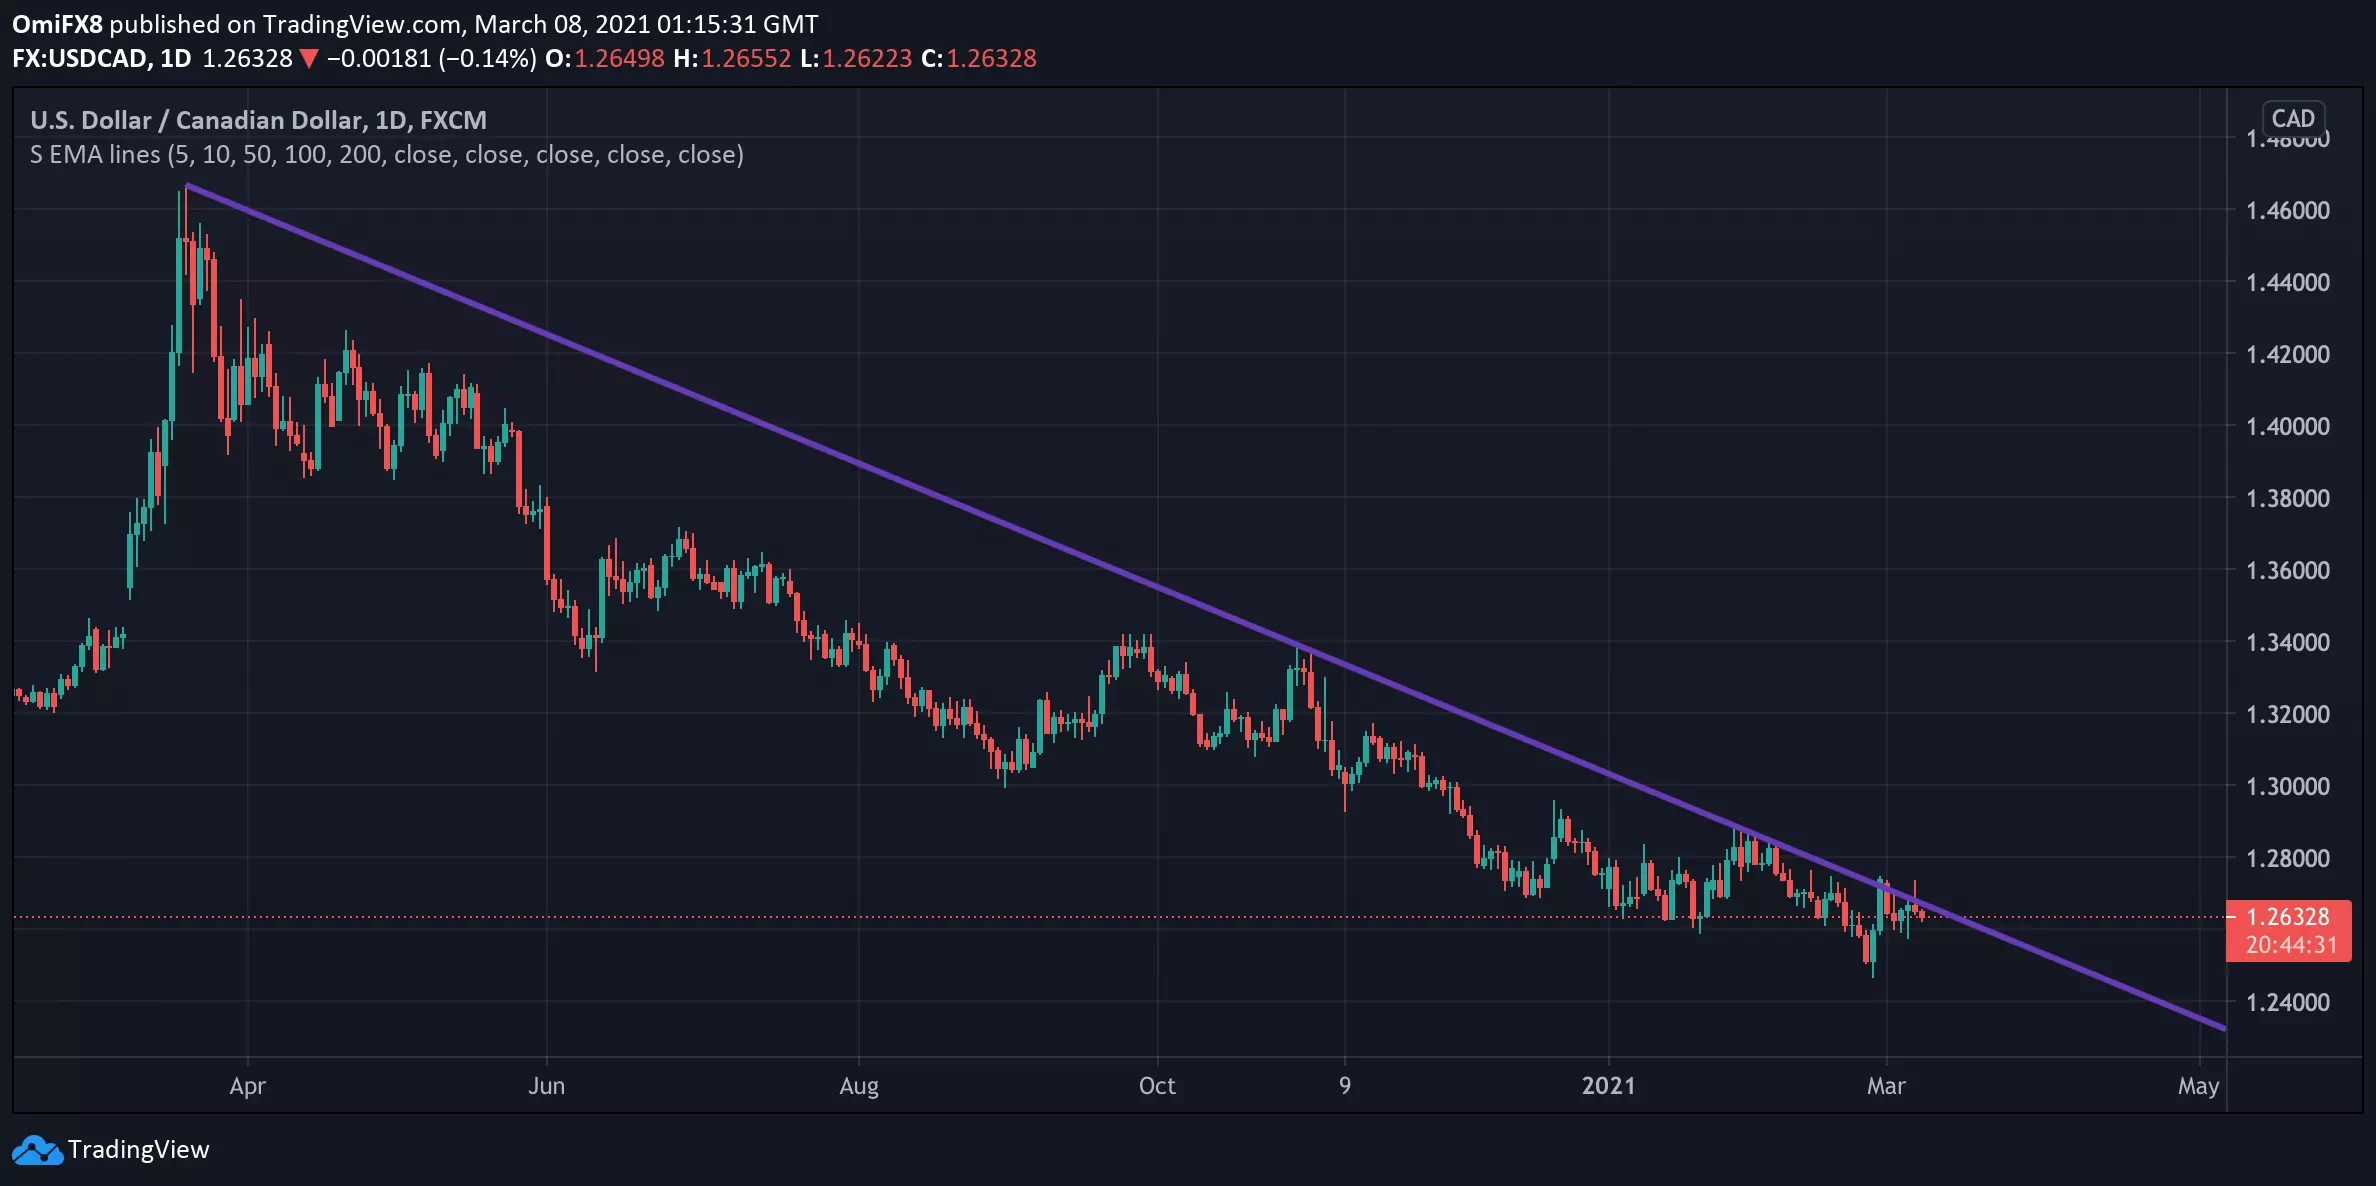
The pair's daily chart shows the bulls failed to establish a foothold above the trendline falling from March 202 highs on Friday. Also, the pair faced rejection at the trendline hurdle early today before falling to 1.2633.
A strong close above the descending trendline would imply an end of the 12-month bearish trend and expose resistance at 1.2881 (Jan. 28 high), above which, the focus would shift to 1.30.
As of now, the pair looks south. Support is seen at 1.2575 (March 4 low) and 1.2468 (Feb. 25 low).
Daily chart
Trend: Bearish
Technical levels
Author

Omkar Godbole
FXStreet Contributor
Omkar Godbole, editor and analyst, joined FXStreet after four years as a research analyst at several Indian brokerage companies.


