|

USD/CAD Price Analysis: Bullish engulfing candle emerges, as buyers eye 1.3700

  • USD/CAD snaps three days of losses, forming a bullish engulfing candle pattern
  • USD/CAD Price Analysis: A decisive break above 1.3600 exposes 1.3700; otherwise, a fall to 1.3500 is on the cards.

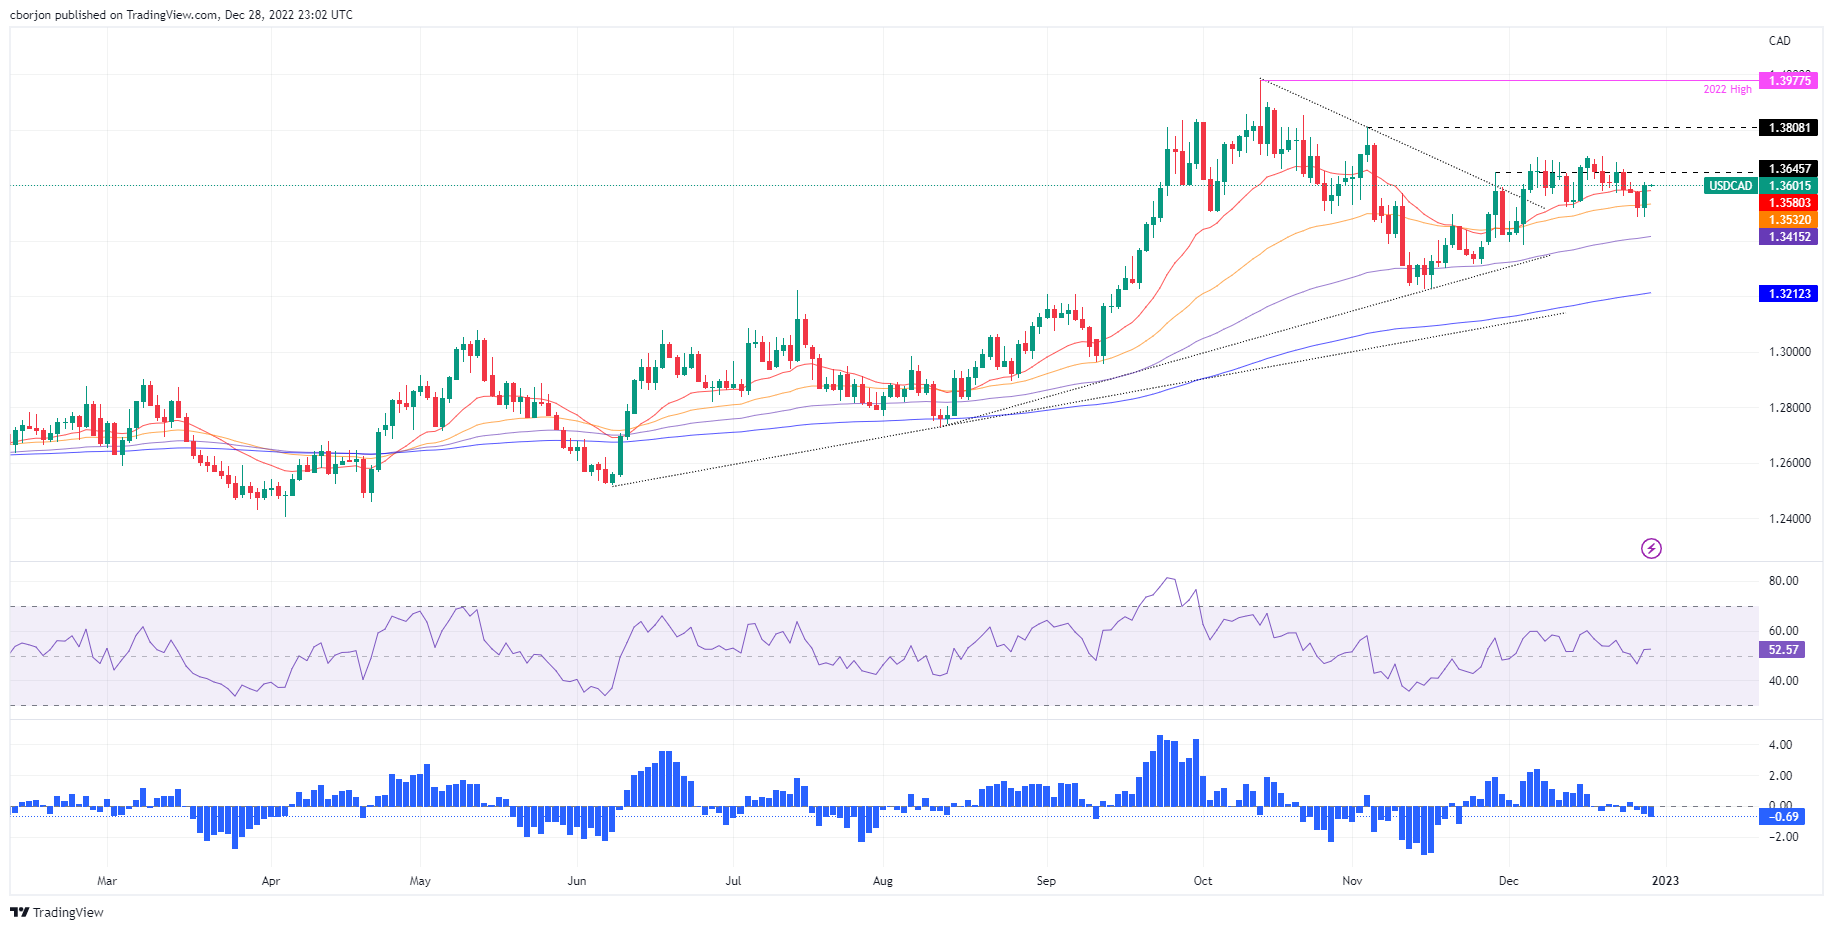
The USD/CAD hurdles the 20-day Exponential Moving Average (EMA) at 1.3580, back above the 1.3600 threshold for the third time in the week, as the pair formed a bullish engulfing candle pattern. As the Asian session begins, the USD/CAD is trading at 1.3601, registering minimal gains of 0.02%.

USD/CAD Price Analysis: Technical outlook

From a daily chart perspective, the USD/CAD pair remains neutral-to-upward biased after peaking twice at around 1.3704, forming a double top. Nevertheless, failure to extend its losses below the 50-day EMA at 1.3532 exacerbated a rally above 1.3600, as the USD/CAD looks poised to re-test the 1.3700 mark ahead of the next year. Even though the Relative Strength Index (RSI) is in bullish territory but almost flat, and the Rate of Change (RoC) suggests that sellers are losing momentum, the USD/CAD might consolidate on either side of the 1.3600 mark. Also, the lack of economic data through the week’s reminder might refrain traders from opening fresh bets in the USD/CAD pair.

If the USD/CAD decisively clears 1.3600, the next resistance would be the 1.3700 figure. Break above will expose November’s high of 1.3808, ahead of the YTD high of 1.3977. As an alternate scenario, the USD/CAD first support would be the 20-day EMA at 1.3580, followed by the 50-day EMA at 1.3532, ahead of the 1.3500 figure.

USD/CAD Key Technical Levels

USD/CAD

Overview
Today last price1.3604
Today Daily Change0.0085
Today Daily Change %0.63
Today daily open1.3519
 
Trends
Daily SMA201.359
Daily SMA501.3537
Daily SMA1001.3421
Daily SMA2001.3106
 
Levels
Previous Daily High1.3585
Previous Daily Low1.3484
Previous Weekly High1.3704
Previous Weekly Low1.3563
Previous Monthly High1.3808
Previous Monthly Low1.3226
Daily Fibonacci 38.2%1.3523
Daily Fibonacci 61.8%1.3546
Daily Pivot Point S11.3474
Daily Pivot Point S21.3429
Daily Pivot Point S31.3374
Daily Pivot Point R11.3574
Daily Pivot Point R21.363
Daily Pivot Point R31.3675

Author

Christian Borjon Valencia

Markets analyst, news editor, and trading instructor with over 14 years of experience across FX, commodities, US equity indices, and global macro markets.

More from Christian Borjon Valencia
Share:

Editor's Picks

EUR/USD eyes nine-day EMA barrier after rebounding from 1.1600

EUR/USD gains ground after registering modest losses in the previous session, trading around 1.1620 during the Asian hours on Friday. The technical analysis of the daily chart suggests an ongoing bearish bias as the pair remains within the descending channel pattern.

GBP/USD drifts lower heading into NFP range

GBP/USD edged lower by 0.2% on Thursday, settling close to 1.3350 in a strained trading session that kept the pair pinned near three-month lows. Price briefly recovered earlier in the day on reports that Iran had indirectly signaled openness to talks with the CIA, but the bounce faded as Israeli officials reportedly advised Washington to disregard the overture. 

Gold recovers above $5,100 ahead of US NFP report

Gold price jumps back above $5,100 in the Asian session on Friday. The precious metal regains traction, helped by a fresh bout of US Dollar selling and persisting risk-off flows. The US employment report for February will take center stage later on Friday. 

Ethereum pull in $169M as validators pile in to stake ETH

US spot Ethereum exchange-traded funds recorded $169 million in net inflows on Wednesday, marking the largest daily intake in two months, according to SoSoValue data. The rise in inflows signals renewed institutional interest in Ethereum amid broader market volatility.

The market compass is pointing at a barrel of Oil

The Asian open is arriving with equities leaning the wrong way, and the reason is not complicated. The market’s compass needle has snapped firmly toward crude. In this tape, oil is not just another input price; it is the gravitational center around which every asset class is orbiting.

Ripple tests recovery strength amid steady ETF inflows, growing retail interest

Ripple (XRP) continues to demonstrate notable resilience as the cryptocurrency market navigates the persistent war in the Middle East after the United States (US) and Israel attacked Iran on Saturday.