|

USD/CAD Price Analysis: Breaks out of Symmetrical Triangle pattern

  • USD/CAD breaks out of a large symmetrical triangle price pattern, activating upside targets. 
  • Though it has backed and filled since the break, the probabilities favor a continuation higher. 
  • A break above the June 11 high would provide additional bullish confirmation. 

USD/CAD has decisively broken above the upper borderline of a large Symmetrical Triangle price pattern on the daily price chart

USD/CAD Daily Chart


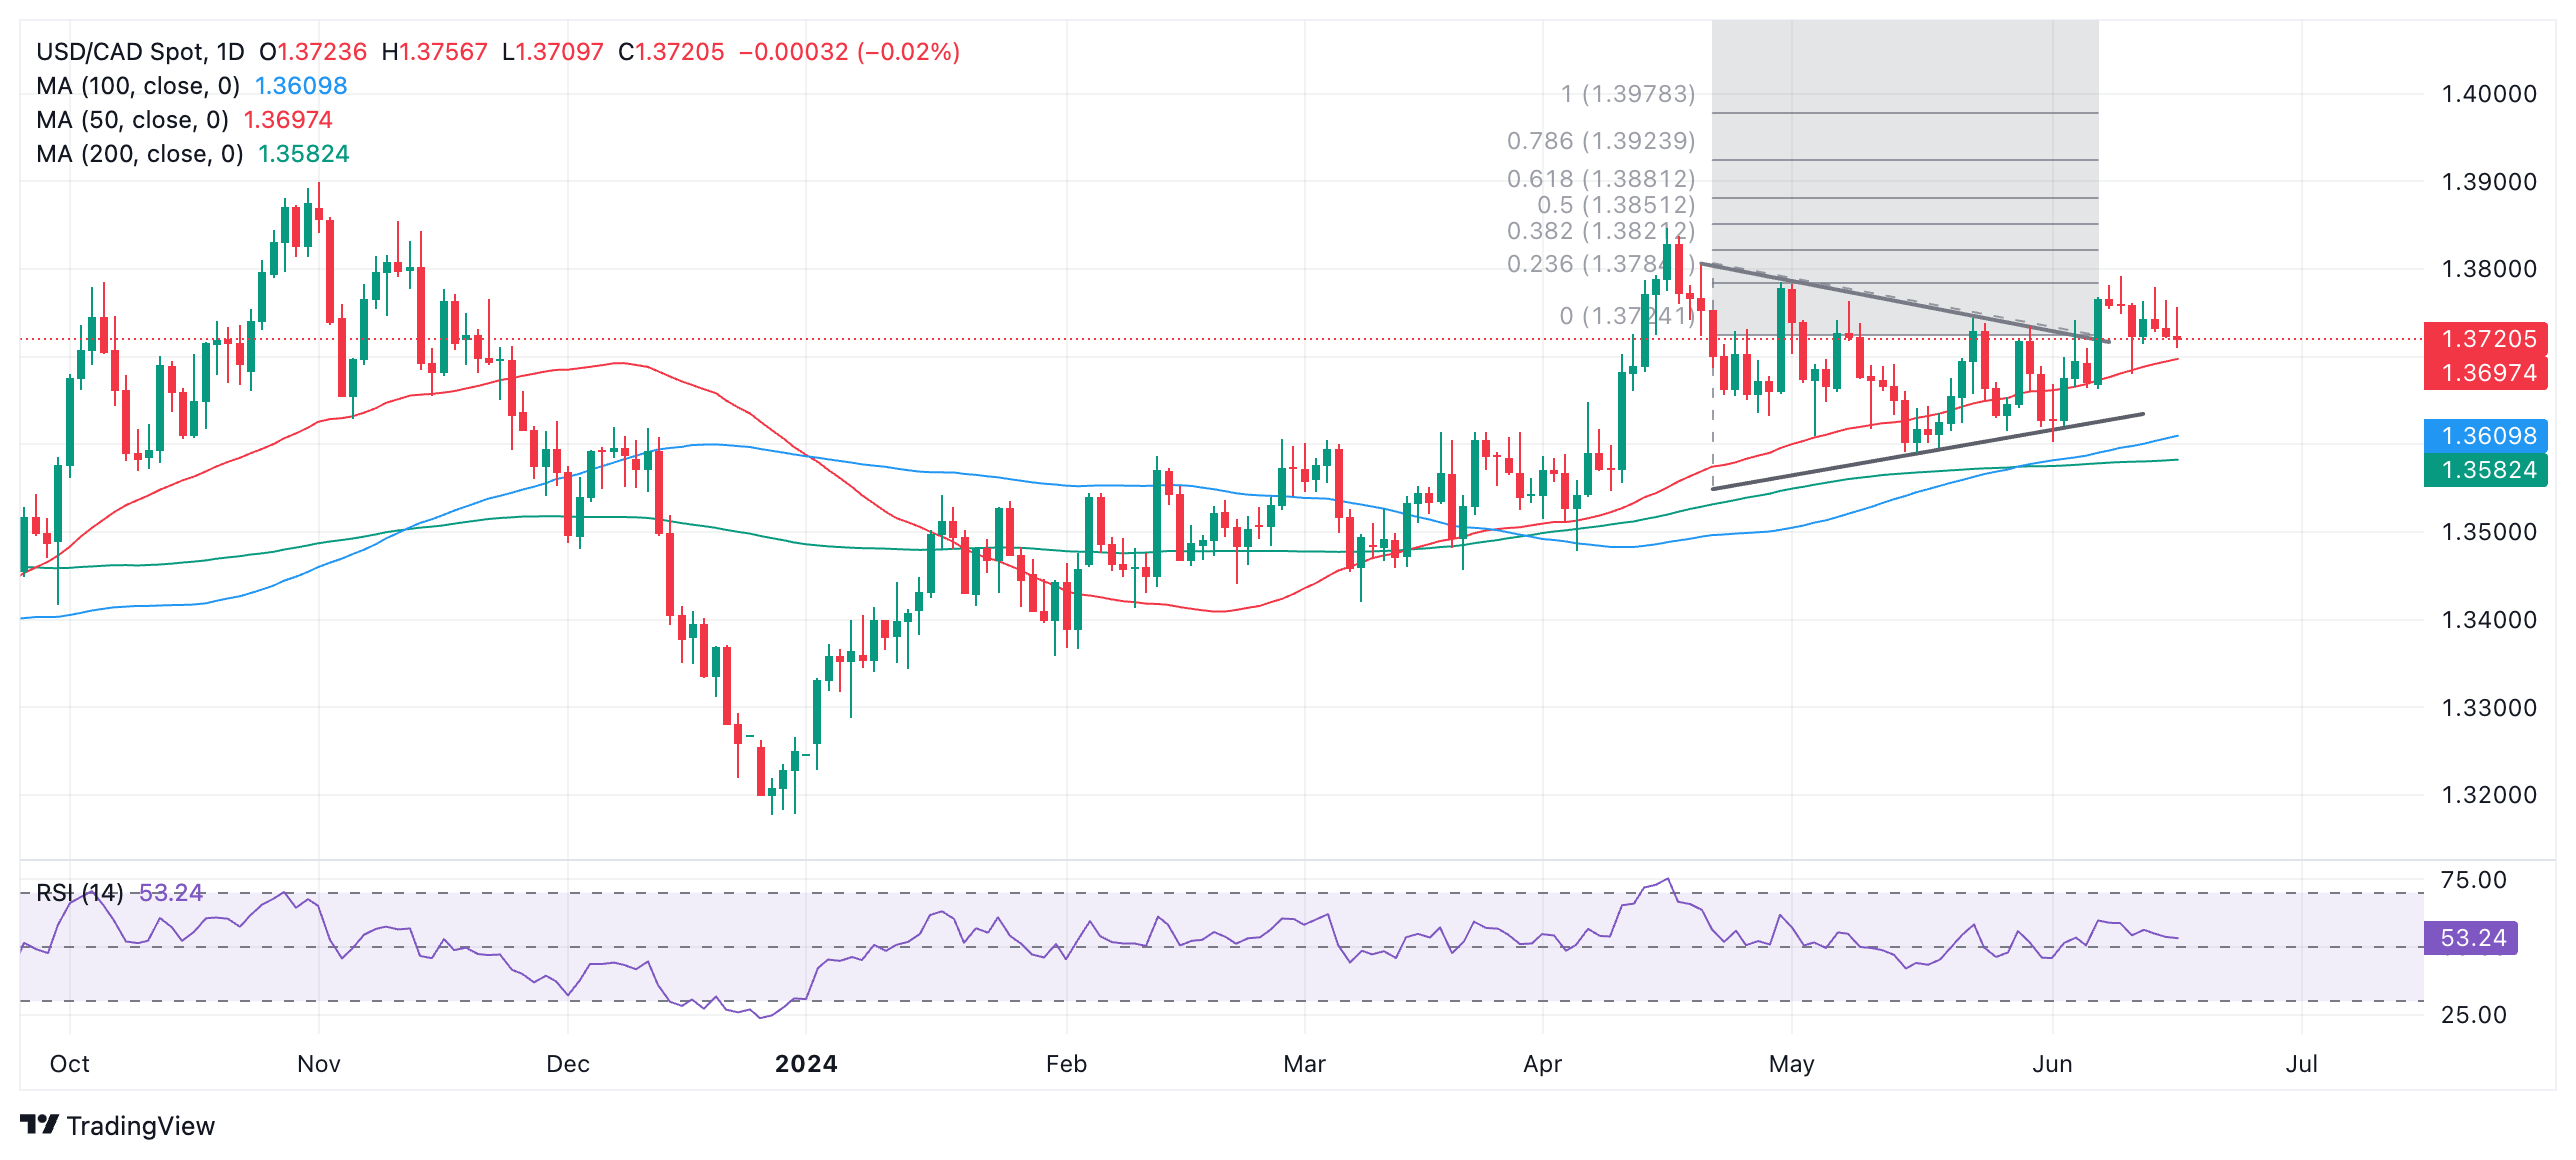
The long green bullish candle that formed on June 7 and accompanied the upside breakout from the Triangle qualifies as the decisive break and activates the bullish targets for the pattern. The conservative target for the pattern lies at 1.3881, the 0.618 Fibonacci extrapolation of the height of the Triangle from the breakout point higher. 

A more bullish target lies at 1.3978, the 100% extrapolation of the height of the triangle northwards. 

Although price action has been slightly bearish since the June 7 breakout, the odds favor a resumption of the initial move higher. A break above 1.3791 (June 11 high) would provide further bullish confirmation. 

A decisive breakdown from the triangle would reverse the trend and suggest a move down to an initial target at roughly 1.3472. 

Author

Joaquin Monfort

Joaquin Monfort is a financial writer and analyst with over 10 years experience writing about financial markets and alt data. He holds a degree in Anthropology from London University and a Diploma in Technical analysis.

More from Joaquin Monfort
Share:

Editor's Picks

EUR/USD recedes to daily lows near 1.1850

EUR/USD keeps its bearish momentum well in place, slipping back to the area of 1.1850 to hit daily lows on Monday. The pair’s continuation of the leg lower comes amid decent gains in the US Dollar in a context of scarce volatility and thin trade conditions due to the inactivity in the US markets.

GBP/USD resumes the downtrend, back to the low-1.3600s

GBP/USD rapidly leaves behind Friday’s decent advance, refocusing on the downside and retreating to the 1.3630 region at the beginning of the week. In the meantime, the British Pound is expected to remain under the microscope ahead of the release of the key UK labour market report on Tuesday.

Gold looks inconclusive around $5,000

Gold partially fades Friday’s strong recovery, orbiting around the key $5,000 region per troy ounce in a context of humble gains in the Greenback on Monday. Additing to the vacillating mood, trade conditions remain thin amid the observance of the Presidents Day holiday in the US.

Bitcoin consolidates as on-chain data show mixed signals

Bitcoin price has consolidated between $65,700 and $72,000 over the past nine days, with no clear directional bias. US-listed spot ETFs recorded a $359.91 million weekly outflow, marking the fourth consecutive week of withdrawals.

The week ahead: Key inflation readings and why the AI trade could be overdone

It is likely to be a quiet start to the week, with US markets closed on Monday for Presidents Day. European markets are higher across the board and gold is clinging to the $5,000 level after the tamer than expected CPI report in the US reduced haven flows to precious metals.

Monero Price Forecast: XMR risks a drop below $300 under mounting bearish pressure

Monero (XMR) starts the week under pressure, recording a 4% decline at press time on Monday after a 7% drop the previous day, putting the $300 support zone in focus.