|

USD/CAD Price Analysis: 200-DMA remains a tough nut to crack for the bulls

  • USD/CAD loses bullish traction amid firmer WTI prices, USD pullback.
  • USD/CAD’s upswing above 21-DMA falters at the 200-DMA.
  • Daily RSI wavers at 50.00, impending bear cross threatens the upside.

USD/CAD is trading modestly flat around mid-1.2400s in Monday’s early trades, having finished Friday almost unchanged.

The upside in the major faltered in the second half of the previous week after WTI prices resumed their uptrend while the US dollar lost its footing after Fed’s patient stance.

Heading into a fresh week, investors digest the latest comments from the Bank of Canada (BOC) Governor Macklem on inflation, as the focus shifts towards Fed Chair Jerome Powell’s appearances and the US Consumer Price Index (CPI) data due later this week.

Looking at USD/CAD’s daily chart, the pair is looking for a fresh directional impetus after forming a Doji candlestick on Friday.

The renewed upswing triggered in the major on acceptance above the 21-Daily Moving Average (DMA) near 1.2395 ran into strong offers at the horizontal 200-DMA at 1.2477.

For the bulls to regain control, the pair needs to find a strong foothold above the latter. The next bullish target is then envisioned at the 1.2500 level.

USD/CAD: Daily chart

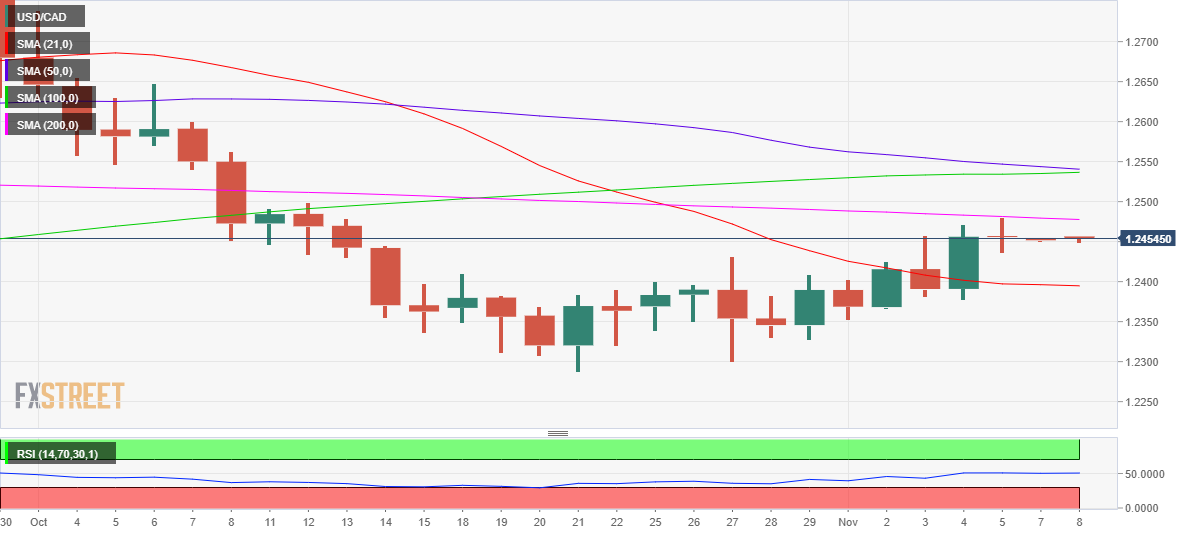
The Relative Strength Index (RSI) trades at the 50.00 level, pointing to a lack of clear directional bias for now.

Meanwhile, the 50-DMA is set to cut the 100-DMA from above, which if occurs will confirm a bear cross on the said timeframe, triggering a fresh downswing in the major.

Sellers will then look to retest the 21-DMA, the resistance-turned-support, below which the downside will open up towards 1.2300.

USD/CAD: Additional levels

USD/CAD

Overview
Today last price1.2453
Today Daily Change-0.0003
Today Daily Change %-0.02
Today daily open1.2456
 
Trends
Daily SMA201.2393
Daily SMA501.2547
Daily SMA1001.2534
Daily SMA2001.2481
 
Levels
Previous Daily High1.248
Previous Daily Low1.2436
Previous Weekly High1.248
Previous Weekly Low1.2352
Previous Monthly High1.2739
Previous Monthly Low1.2288
Daily Fibonacci 38.2%1.2453
Daily Fibonacci 61.8%1.2463
Daily Pivot Point S11.2435
Daily Pivot Point S21.2414
Daily Pivot Point S31.2392
Daily Pivot Point R11.2479
Daily Pivot Point R21.2501
Daily Pivot Point R31.2522

Author

Dhwani Mehta

Dhwani Mehta

FXStreet

Residing in Mumbai (India), Dhwani is a Senior Analyst and Manager of the Asian session at FXStreet. She has over 10 years of experience in analyzing and covering the global financial markets, with specialization in Forex and commodities markets.

More from Dhwani Mehta
Share:

Editor's Picks

EUR/USD weakens below 1.1700 as Middle East tensions drive US Dollar strength

The EUR/USD pair trades with mild losses around 1.1685, the lowest since late January, during the early Asian session on Tuesday. The US Dollar gathers strength against the Euro as escalating tensions in the Middle East boost safe-haven currencies. The preliminary reading of the Harmonized Index of Consumer Prices from the Eurozone will be published later on Tuesday.  

GBP/USD hits new yearly lows near 1.3300

GBP/USD adds to the recent bearish tone, approaching to the key 1.3300 support to reach fresh YTD troughs against the backdrop of the robust performance of the US Dollar. Indeed, Cable’s decline comes amid the firm demand for the safe-haven space in the wake of the US and Israel attacks to Iran.

Gold defends bids as US-Iran war continues to fuel safe-haven flows

Gold retains positive bias for the fifth consecutive day on Tuesday as rising geopolitical tensions in the Middle East continue to underpin safe-haven assets. However, a bullish US Dollar keeps the bullion below its highest level since late January, set on Monday, warranting caution before positioning for any further appreciation.

Strategy lifts holdings to 3.4% of Bitcoin's total supply amid inflows into crypto products

Strategy continued its accumulation of the top crypto last week, acquiring 3,015 BTC for $204 million amid renewed interest in crypto products after four weeks of outflows.

The market is not panicking it is repricing the probability distribution of Oil and time

At the end of the day, markets do not trade morality or geopolitics. They trade transmission channels. And the only channel that truly matters in this maelstrom runs through the price of energy and the time value of money.

Grass 20% bullish breakout defies broader market weakness

Grass (GRASS) is edging up above $0.30 at the time of writing on Monday. The token’s notable 20% intraday surge stands out amid heightened volatility in the broader crypto market.