USD/CAD edges lower as Canada’s inflation steadies in May
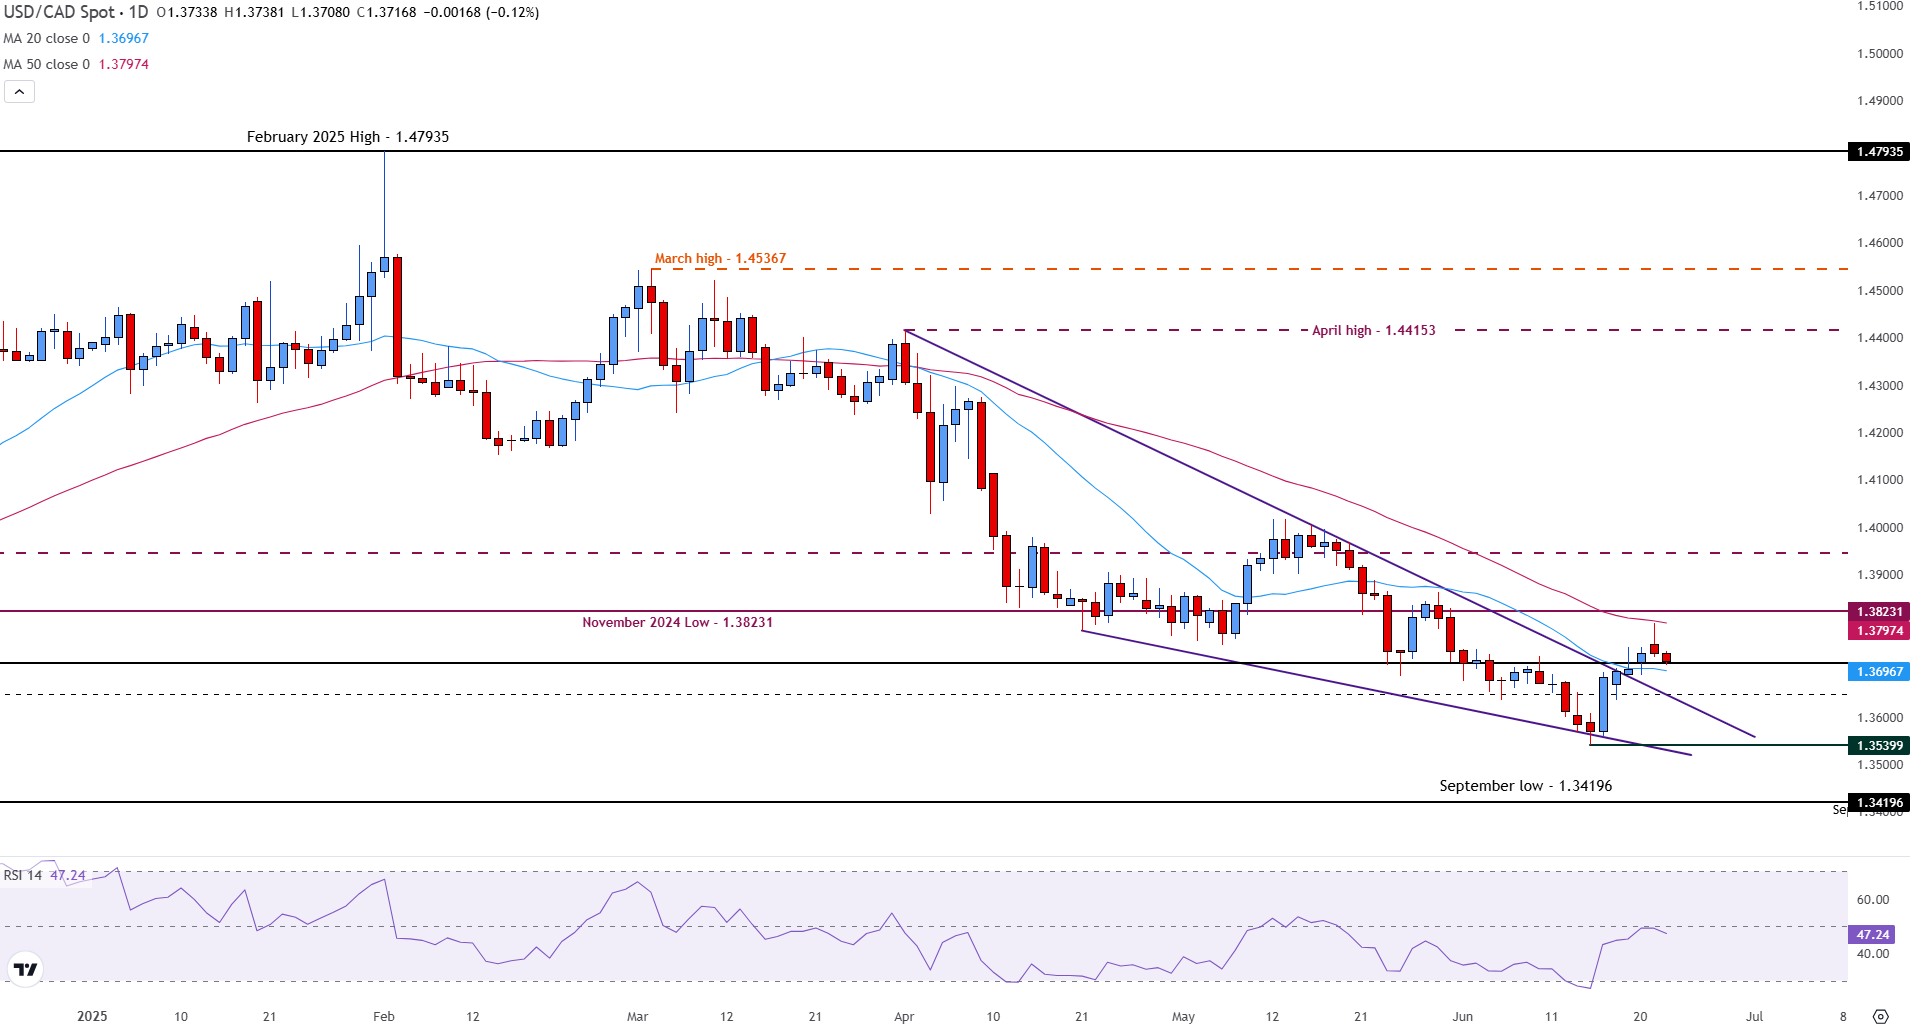
- USD/CAD trades near 1.3710 as traders digest Canada’s latest inflation report.
- Canada’s BoC Core Consumer Price Index (CPI) data for May printed in line with analyst forecasts.
- Bank of Canada (BoC) policy outlook - OIS market data shows a 38% probability of a rate hold at the July meeting.,

The Canadian Dollar (CAD) is reacting to the latest Consumer Price Index (CPI) data released by Statistics Canada on Tuesday, which showed inflation steadying in May.
USD/CAD is trading around 1.3710 following the release, with markets reassessing rate cut prospects.
Canada CPI data summary
Canada’s May inflation data showed that the BoC Core Consumer Price Index (CPI) rose by 0.6% (MoM) in May, slightly above the previous reading of 0.5%. The YoY figure held steady at 2.5%.
The headline CPI rose 0.6% (MoM), above analyst expectations of a 0.5% increase, while the YoY figure rose 1.7%, in line with estimates.
The BoC Core CPI, which strips out volatile components such as food and energy, is viewed as a more accurate measure of underlying inflation.
What does this mean for the Bank of Canada?
With the BoC holding its key rate at 2.75% during the June policy meeting, BoC Governor Tiff Macklem raised concerns over tariffs and rising input costs. The Governor stated that the central bank is closely monitoring both the headline CPI and business sentiment.
The core print still signals persistent price pressures, which could lead the Bank of Canada to delay rate cuts as it continues to monitor inflation dynamics and their implications for monetary policy. With Core CPI still above the Bank of Canada's 2% target, Canadian OIS market data indicates a 38% probability of a rate hold at the July meeting.
USD/CAD market reaction
USD/CAD is expected to move after the release, as traders BoC unless the economy shows signs of weakening.
The pair continues to trade between the 20-day Simple Moving Average (SMA), providing support at 1.3697, and the 50-day SMA, which acts as resistance at 1.3798.
(This story was corrected on June 24 at 14:00 GMT to say in the CPI summary that headline CPI rose 0.6%, above the 0.5% forecast and not in line with analyst estimates.)
Bank of Canada FAQs
The Bank of Canada (BoC), based in Ottawa, is the institution that sets interest rates and manages monetary policy for Canada. It does so at eight scheduled meetings a year and ad hoc emergency meetings that are held as required. The BoC primary mandate is to maintain price stability, which means keeping inflation at between 1-3%. Its main tool for achieving this is by raising or lowering interest rates. Relatively high interest rates will usually result in a stronger Canadian Dollar (CAD) and vice versa. Other tools used include quantitative easing and tightening.
In extreme situations, the Bank of Canada can enact a policy tool called Quantitative Easing. QE is the process by which the BoC prints Canadian Dollars for the purpose of buying assets – usually government or corporate bonds – from financial institutions. QE usually results in a weaker CAD. QE is a last resort when simply lowering interest rates is unlikely to achieve the objective of price stability. The Bank of Canada used the measure during the Great Financial Crisis of 2009-11 when credit froze after banks lost faith in each other’s ability to repay debts.
Quantitative tightening (QT) is the reverse of QE. It is undertaken after QE when an economic recovery is underway and inflation starts rising. Whilst in QE the Bank of Canada purchases government and corporate bonds from financial institutions to provide them with liquidity, in QT the BoC stops buying more assets, and stops reinvesting the principal maturing on the bonds it already holds. It is usually positive (or bullish) for the Canadian Dollar.
Author

Tammy Da Costa, CFTe®
FXStreet
Tammy is an economist and market analyst with a deep passion for financial markets, particularly commodities and geopolitics.


