USD/CAD drops below 1.3000 on a soft US Dollar
- The Loonie begins the week on the right foot, up by 0.23%, as shown by the USD/CAD falling.
- An upbeat sentiment boosted the Canadian dollar while the buck weakened.
- USD/CAD Price Forecast: In consolidation, but it’s showing the formation of negative divergence in the daily/4-H chart, opening the door for further losses.

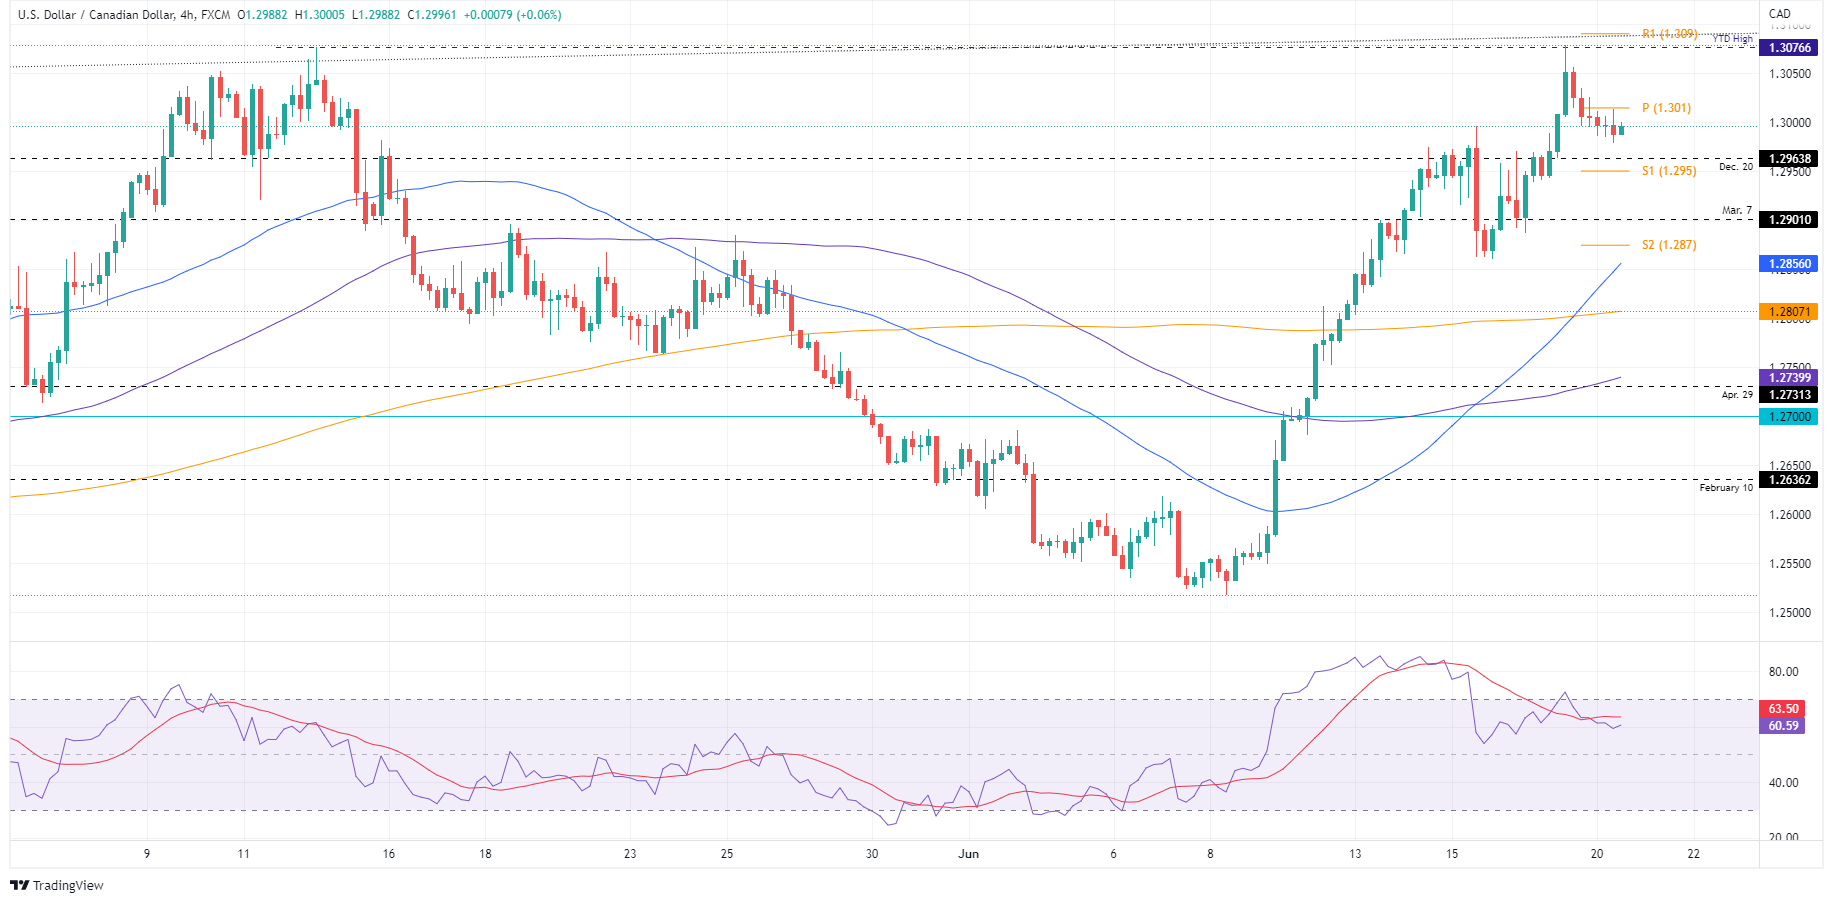
The Loonie gained some ground against the greenback as shown by the USD/CAD pair, retracing from fresh YTD highs at around 1.3076, towards the 1.2990s area, amidst a thin liquidity trading session, courtesy of a bank holiday in the US. At the time of writing, the USD/CAD is trading at 1.2996, down 0.23%.
Sentiment-wise, European bourses closed in the green. Meanwhile, US futures witnessed a shorter trading session, finishing with decent gains between 0.97% and 1.29%. That said, the USD/CAD fell on a risk-on impulse, a headwind for the safe-haven status of the greenback, which remains soft, as shown by the US Dollar Index, down 0.07%, sitting at 104.577.
The lack of data in the Canadian economic docket left USD/CAD traders adrift to Fed speaking. Once the June’s Fed meeting is on the rearview mirror, Fed officials were unleashed.
Over the weekend, Fed Governor Christopher Waller said he supports a 75 bps rate hike in July if data comes as he expected. Cleveland Fed President Loretta Mester said it would take inflation a couple of years to get to the US central bank’s target of 2%, reiterating that some inflation measures looked worse in May than April.
Atlanta’s Fed President Raphael Bostic said he supported a 75 bps in June and emphasized the Fed’s commitment to tame inflation.
In the week ahead, Statistics Canada will unveil May’s CPI, which is expected at 7.3% YoY vs. 6.8% in April, while the common core is estimated at 3.4% YoY vs. 3.2% in April. Ahead of that, April Retail Sales data Tuesday will be of interest. Headline sales are expected at 0.8% MoM vs. 0.0% in March, while sales ex-autos are expected at 0.6% MoM vs. 2.4% in March.
USD/CAD Price Forecast: Technical outlook
The USD/CAD daily chart depicts the pair consolidating after reaching a fresh YTD high at around 1.3076. On Monday, the major shifted downwards, below the 1.3000 mark, but remains confined above December 20, 2021, daily high, in the 1.2964-1.3025 area. USD/CAD traders should be aware that the Relative Strength Index (RSI) is aiming lower, despite the pair’s edging higher, suggesting that a negative divergence could be forming.
In the near term, the USD/CAD 4-hour chart illustrated the pair is trending higher, but the RSI shifted downwards, meaning that daily’s chart negative divergence is also present in this timeframe. Therefore, the USD/CAD is headed downwards.
The USD/CAD first support would be the S1 daily pivot at 1.2950. Break below would expose the 1.2900 figure, followed by the S2 daily pivot point at 1.2870, near the confluence of the 50-period simple moving average (SMA() and June 15 daily low at around the 1.2856-60 area.
Key Technical Levels
Author

Christian Borjon Valencia
FXStreet
Markets analyst, news editor, and trading instructor with over 14 years of experience across FX, commodities, US equity indices, and global macro markets.


