USD/CAD drops as CAD flexes strength, despite stellar US NFP report
- US adds 339K jobs, beating estimates, but USD/CAD stays tepid.
- CAD gains momentum on a 1.70% surge in WTI Crude Oil prices.
- Uncertain Fed rate hike in July overshadows USD’s future trajectory.

USD/CAD registers modest losses after an outstanding jobs report in the United States (US) would likely keep the US Federal Reserve (Fed) hitting the economy’s brakes, despite recent dovish comments supporting a pause. Nevertheless, the US Dollar (USD) continued to weaken while the Loonie (CAD) strengthened. At the time of writing, the USD/CAD is trading at 1.3428, down 0.16%.
Strong job growth figures unable to buoy USD; WTI Crude Oil surge lifts CAD, sparking a USD/CAD shake-up
The USD/CAD stopped its fall at around the 200-day Exponential Moving Average (EMA) at 1.3417 on the release of May’s US Nonfarm Payrolls report, revealed by the US Department of Labor. The US economy created 339K jobs in the economy, crushing estimates of 190K, though the Unemployment Rate ticked higher to 3.7% from 3.4%, a 53-year low level.
Although the data supported a stronger US Dollar, the USD/CAD treads water after printing a daily low of 1.3406 ahead of the Nonfarm Payrolls release.
Given the backdrop, crude oil prices were another factor that boosted the CAD, with Western Texas Intermediate (WTI), the US crude oil benchmark, recovering ground gaining 1.70%, at $71.33 per barrel, along with a risk-on impulse, that keeps the greenback pressured through pairing some losses.
The US Dollar Index (DXY), a measure that tracks the buck’s value vs. six currencies, edges up 0.31%, at 103.888, underpinned by increased bets for a July rate hike by the Fed. According to the recent update from the CME FedWatch Tool, the Federal Reserve will likely maintain the current interest rates steady for the month. However, the forecast for July is considerably less definitive, with the likelihood of a rate change teetering at approximately 50.7%.
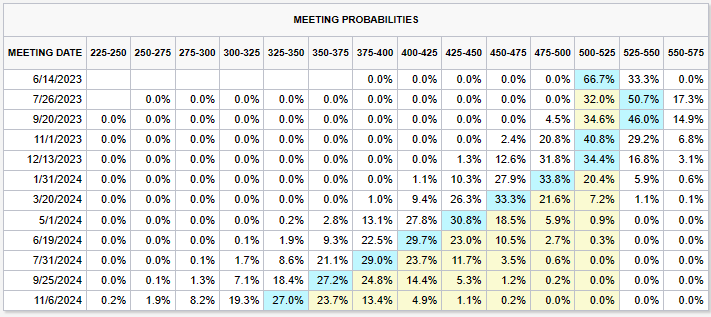
Source: CME Fed Watch Tool
An absent Canadian economic docket left USD/CAD traders leaning on the dynamics of the US Dollar. But recent data showing strong growth in the Canadian economy puts pressure on the Bank of Canada (BoC) to further tighten the economy, at the threat of elevated inflationary pressures.
USD/CAD Price Analysis: Technical outlook
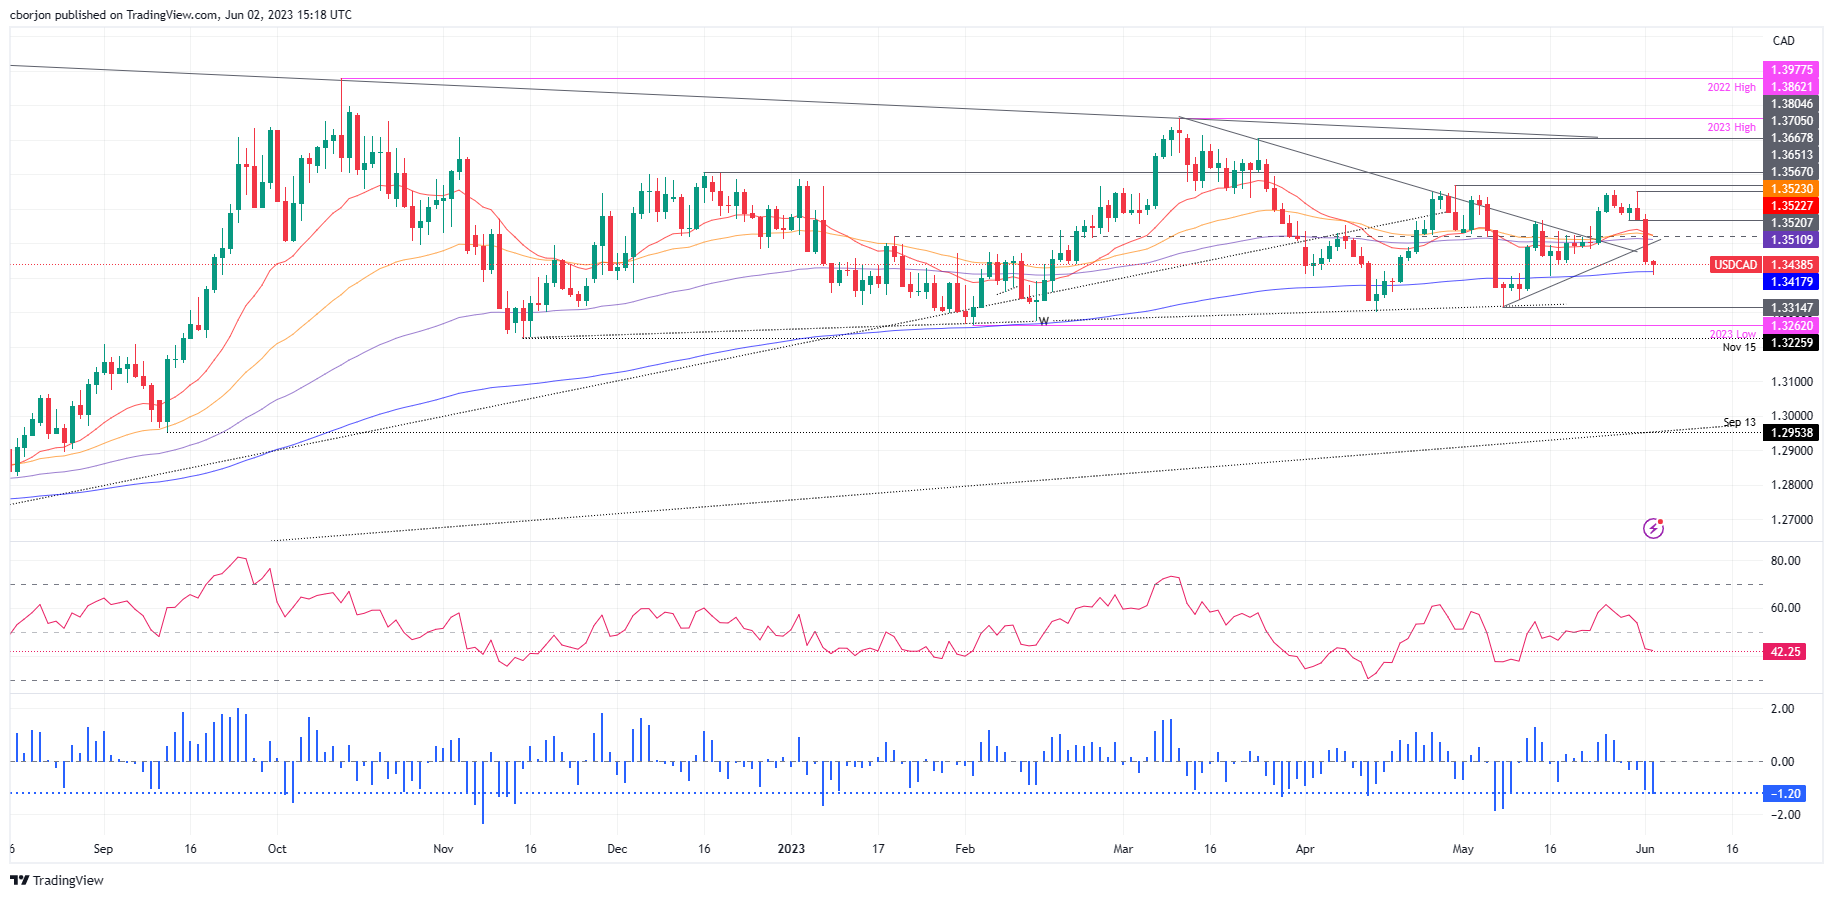
From a technical perspective, USD/CAD faced solid support at the 200-day EMA, with buyers piling in, driving the price 30 pips up. Nevertheless, the Relative Strength Index (RSI) indicator and the 3-day Rate of Change (RoC) in bearish territory suggest downside action in the near term. Therefore, the USD/CAD could be pressured, with support back at the 200-day EMA at 1.3417, before testing 1.3400. Break below will expose May’s low of 1.3314. Conversely, the USD/CAD first resistance would be the 1.3500 figure, followed by the 100-day EMA at 1.3510.
Author

Christian Borjon Valencia
FXStreet
Markets analyst, news editor, and trading instructor with over 14 years of experience across FX, commodities, US equity indices, and global macro markets.