US Treasury yields surge on hot US CPI data, rising rate cut hesitations
- US 10-year Treasury yields hit two-month high following January's unexpected inflation data.
- Markets now foresee rate stability, with potential Fed easing likely delayed until June.
- 2-year note yield increase to 4.647% reflects revised expectations for the Fed's rate path.
- Increase in 10-year TIPS yield to 2.281% suggests a market view of around 2.3% average inflation in the medium term.

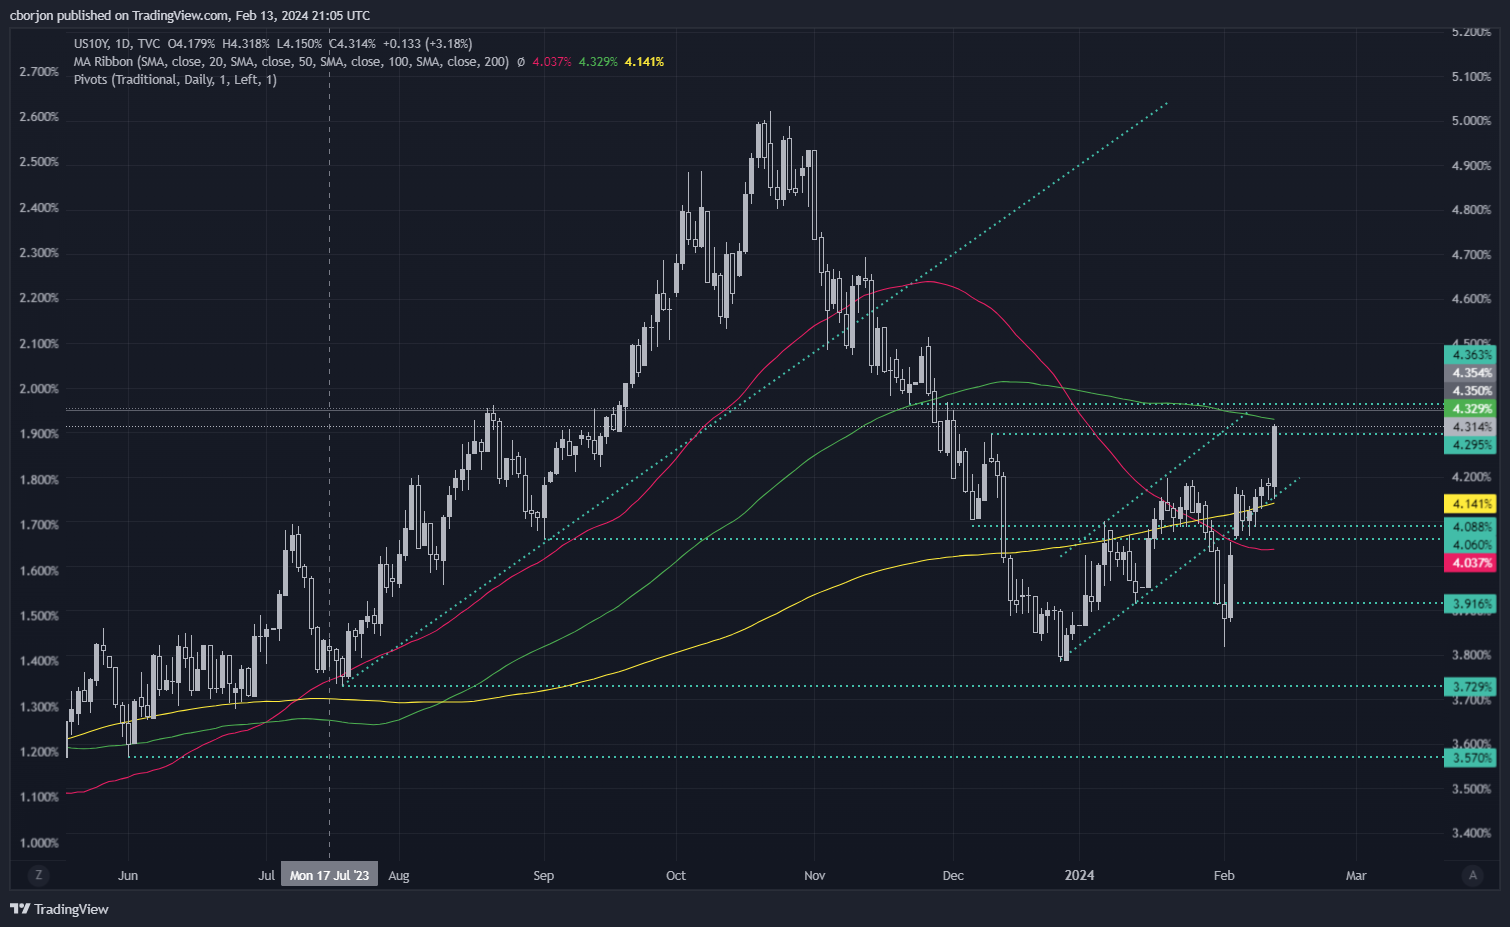
US Treasury bond yields climbed on Tuesday following a red-hot inflation report that pushed out market expectations for a Federal Reserve’s rate cut. Therefore, the US 10-year benchmark note rate hit a two-month high and rose thirteen basis points towards 4.31%.
US Treasury bond yields skyrocketed dimming immediate Fed easing prospects
January’s US inflation data revealed that headline inflation increased above estimates but slowed compared to the previous month’s data. The Consumer Price Index (CPI) was 3.1% YoY, below the previous month’s 3.4% YoY. Underlying inflation, which excludes volatile times, increased to 3.9%, unchanged compared to December’s and above forecasts.
Most traders were expecting inflation to slow down sharply, with CPI foresaw to edge below the 3% threshold, while excluding volatile items, the so-called core, was estimated to dip to 3.7%.
Following the data, speculations that the Fed will keep rates at around the 5.25%-5.50% range grew, with the most likely scenario that Fed Chair Jerome Powell and Co. will keep rates unchanged in March and May. The swaps market shows odds for a 25-basis point Fed cut above 50% for the June meeting. The US 2-year note yield, the most sensitive to interest rates, jumped 16 bps at 4.647%, reflecting investors' stance on interest rates.
In the meantime, Gold prices plummeted below the $2000 mark as demand for US Treasury Inflation-Protected Securities (TIPS), a proxy for real yields, attracted flows, and a headwind for XAU/USD prices. The US 10-year TIPS rose by 2.281%, indicating that market participants see inflation averaging 2.3% for the upcoming medium term.
Technical overview of the US 10-year T-bond yields
The yield of the US 10-year benchmark note is expected to test the 100-day moving average (DMA) at 4.329%, which, once cleared, could pave the way for further upside. The next resistance emerges at4.514% the November 27 cycle high, followed by the November 13 at 4.694%. Conversely, if yields drop, the first support would be the 4.20% threshold, followed by the 200-DMA at 4.141%. A breach of that level could pave the way to challenge the 50-DMA at 4.037%.
Author

Christian Borjon Valencia
FXStreet
Markets analyst, news editor, and trading instructor with over 14 years of experience across FX, commodities, US equity indices, and global macro markets.

















