|
US Dollar Index Technical: Greenback bulls hold the market above 96.30 support

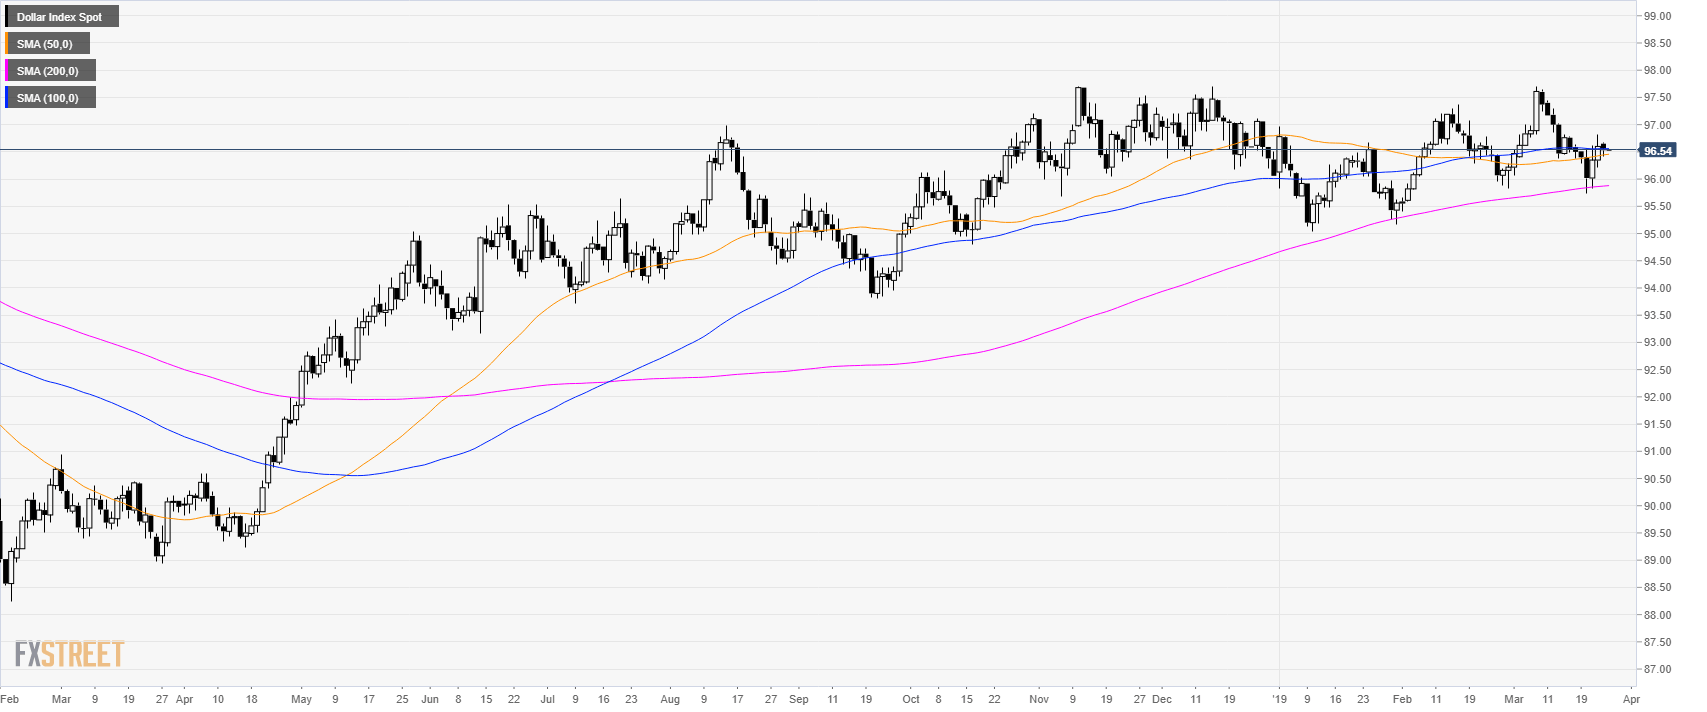
DXY daily chart
- The US Dollar Index (DXY) is trading in a bull trend above its 200-day simple moving average (SMA).
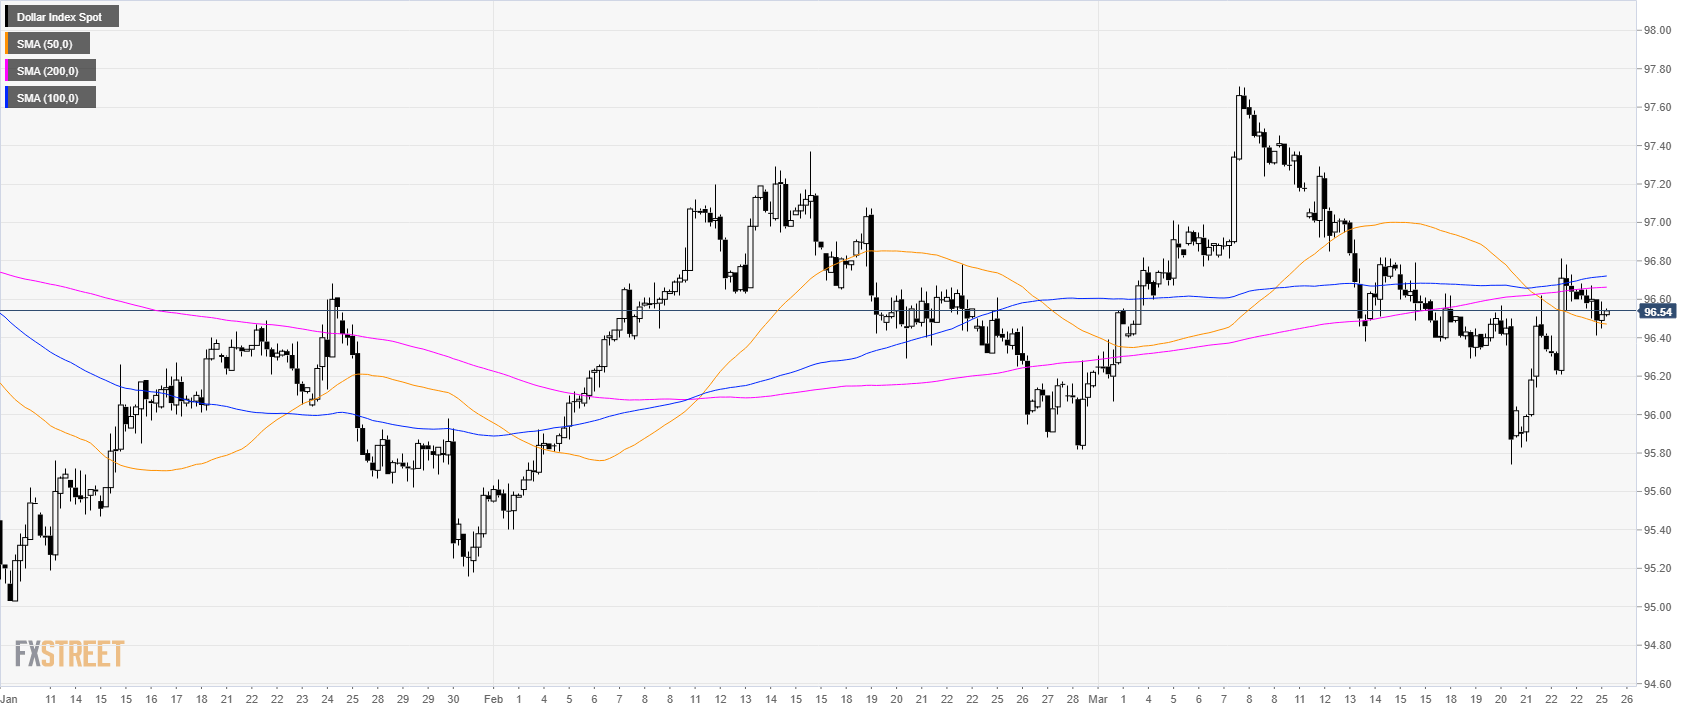
DXY 4-hour chart
- DXY is bouncing from 95.80 support.
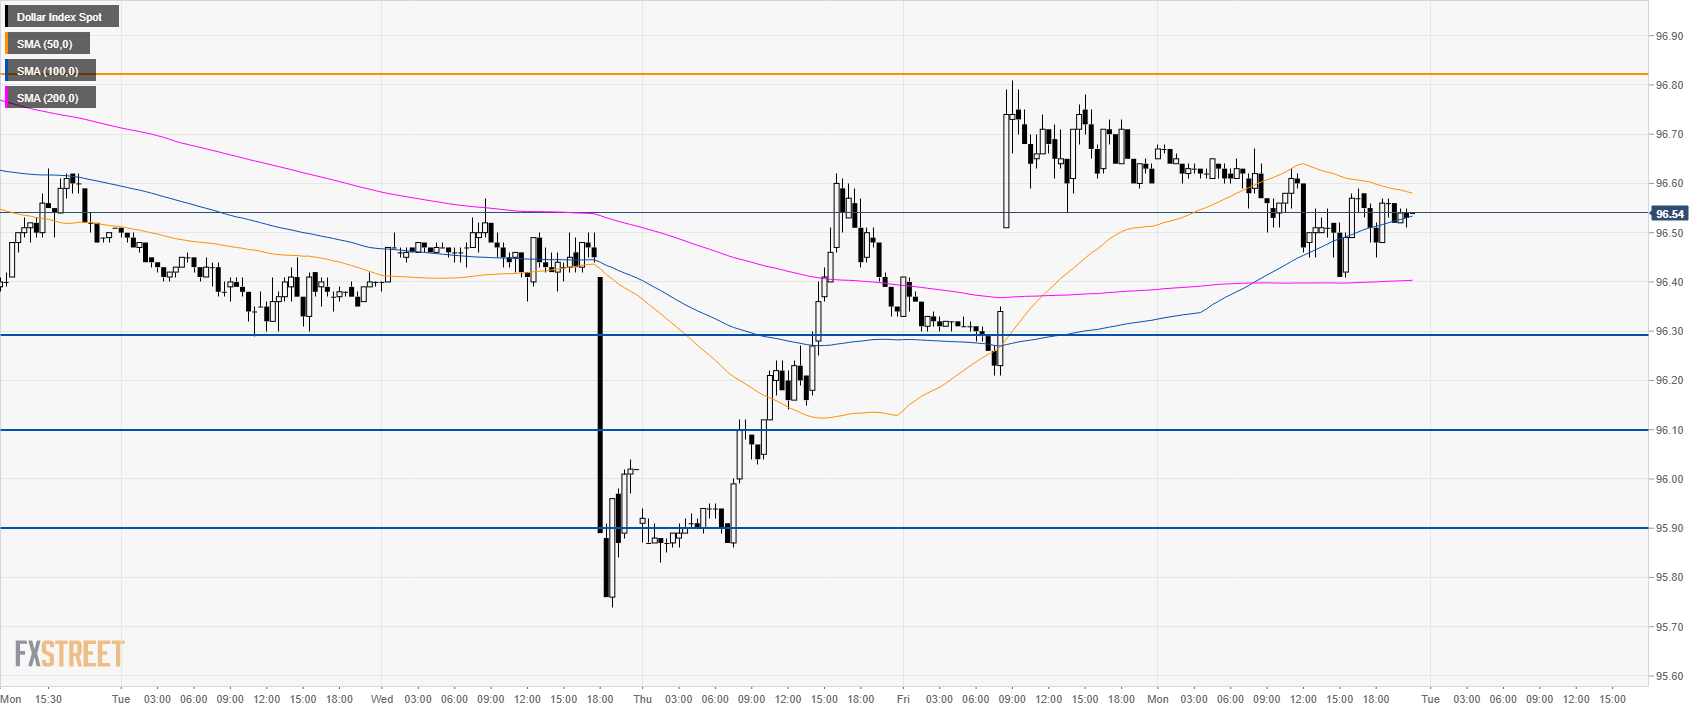
DXY 30-minute chart
- DXY is trading above the 100 and 200 SMAs suggesting bullish momentum in the short-term.
- 96.80, 97.00 and 97.40 can become the next resistances to the upside.
- Support is at 96.30, 96.10 and 95.90 level.
Additional key levels
Author

Flavio Tosti
Independent Analyst
More from Flavio Tosti


