|

US Dollar Index technical analysis: Greenback attempts a come back above the 97.00 handle

  • DXY regained some ground above the 97.00 handle.
  • The 97.30 level can be a tough resistance to break for bulls. 
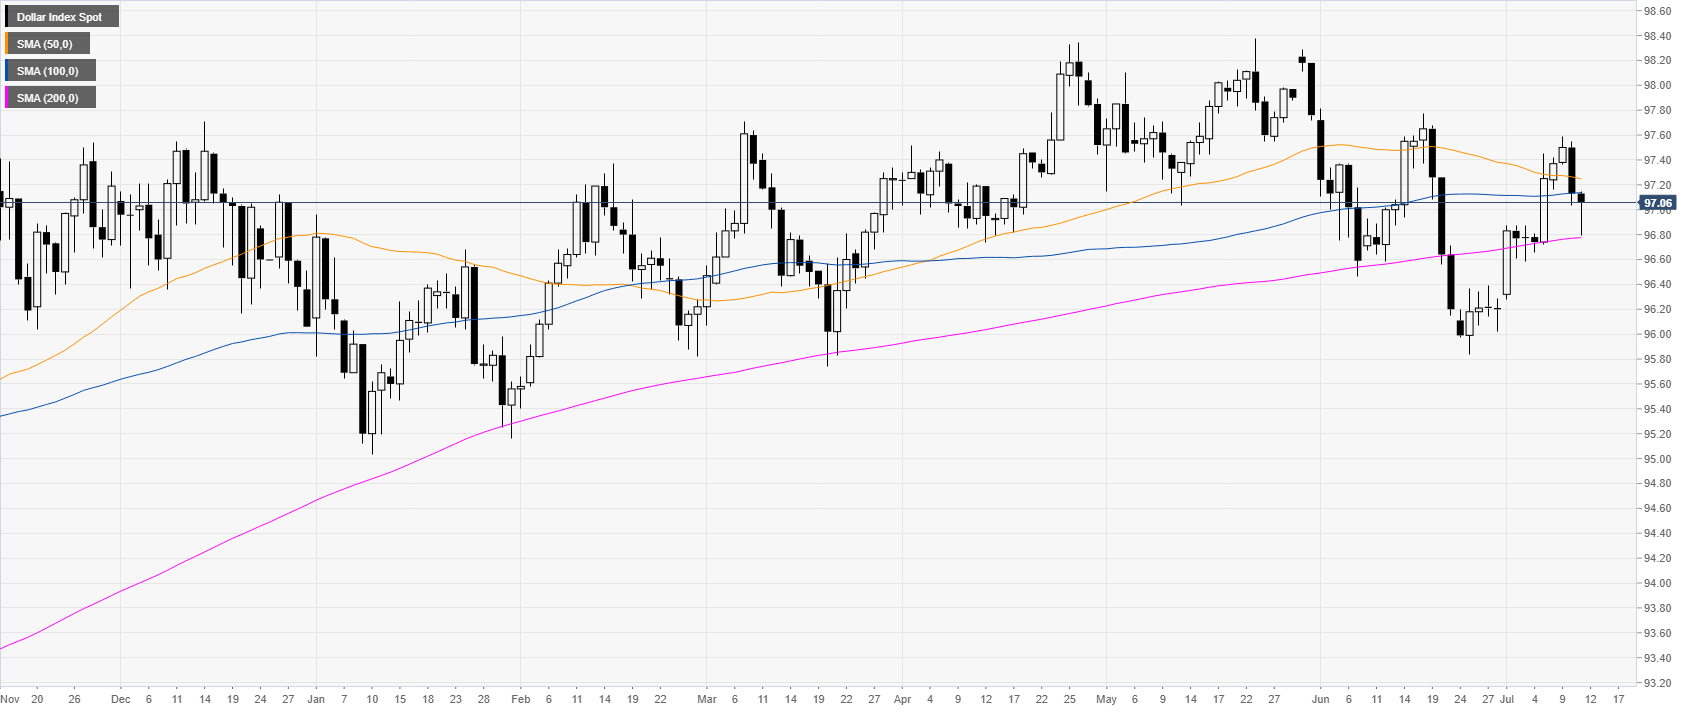
 
DXY daily chart

The US Dollar Index (DXY) tested the 96.80 level and the 200-day simple moving average (DSMA). 
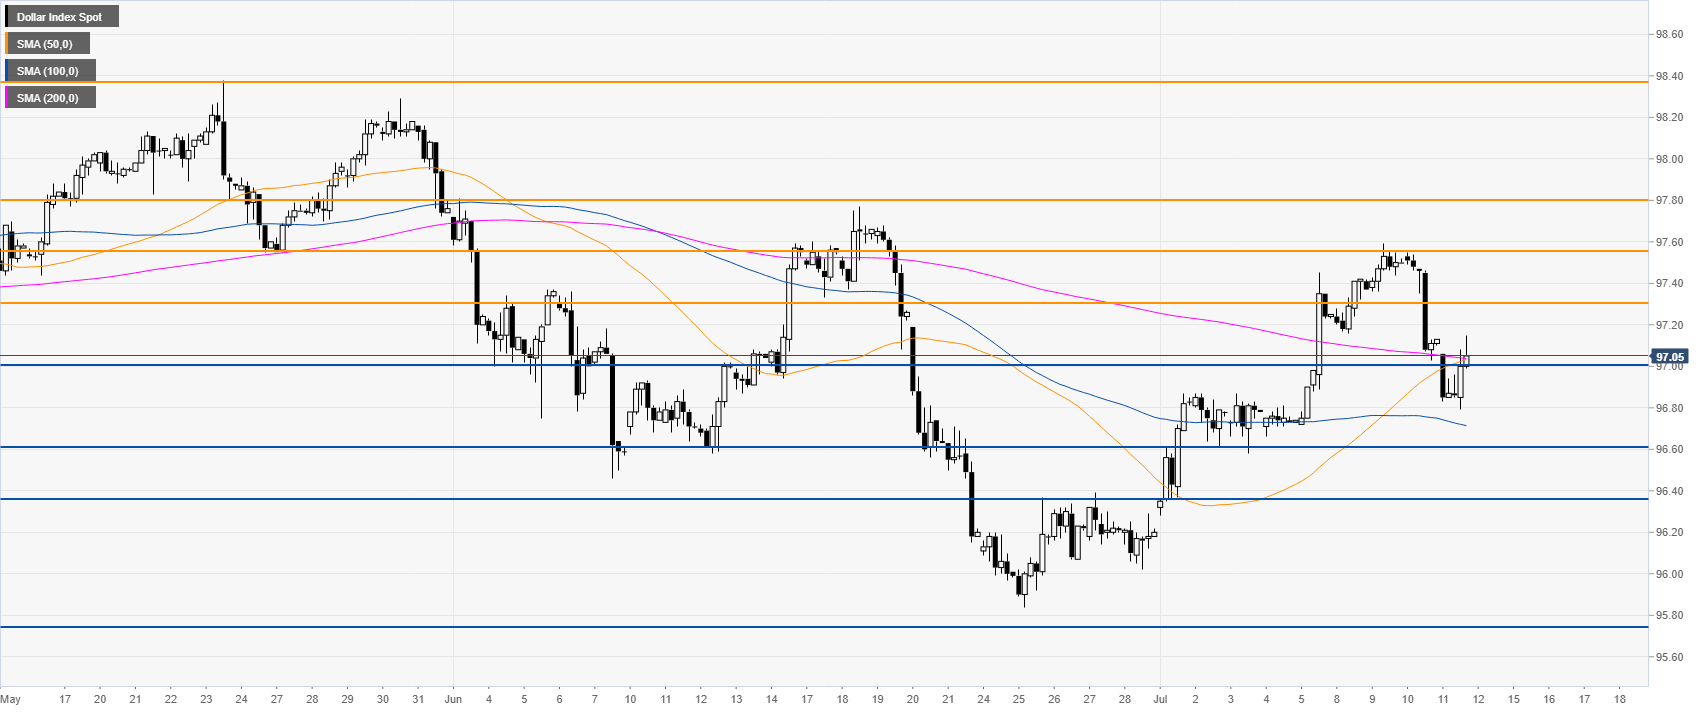
DXY 4-hour chart

The market is challenging the 97.00 handle and the 100/200 SMA. A breach below 97.00 could lead to 96.60 and 96.37.
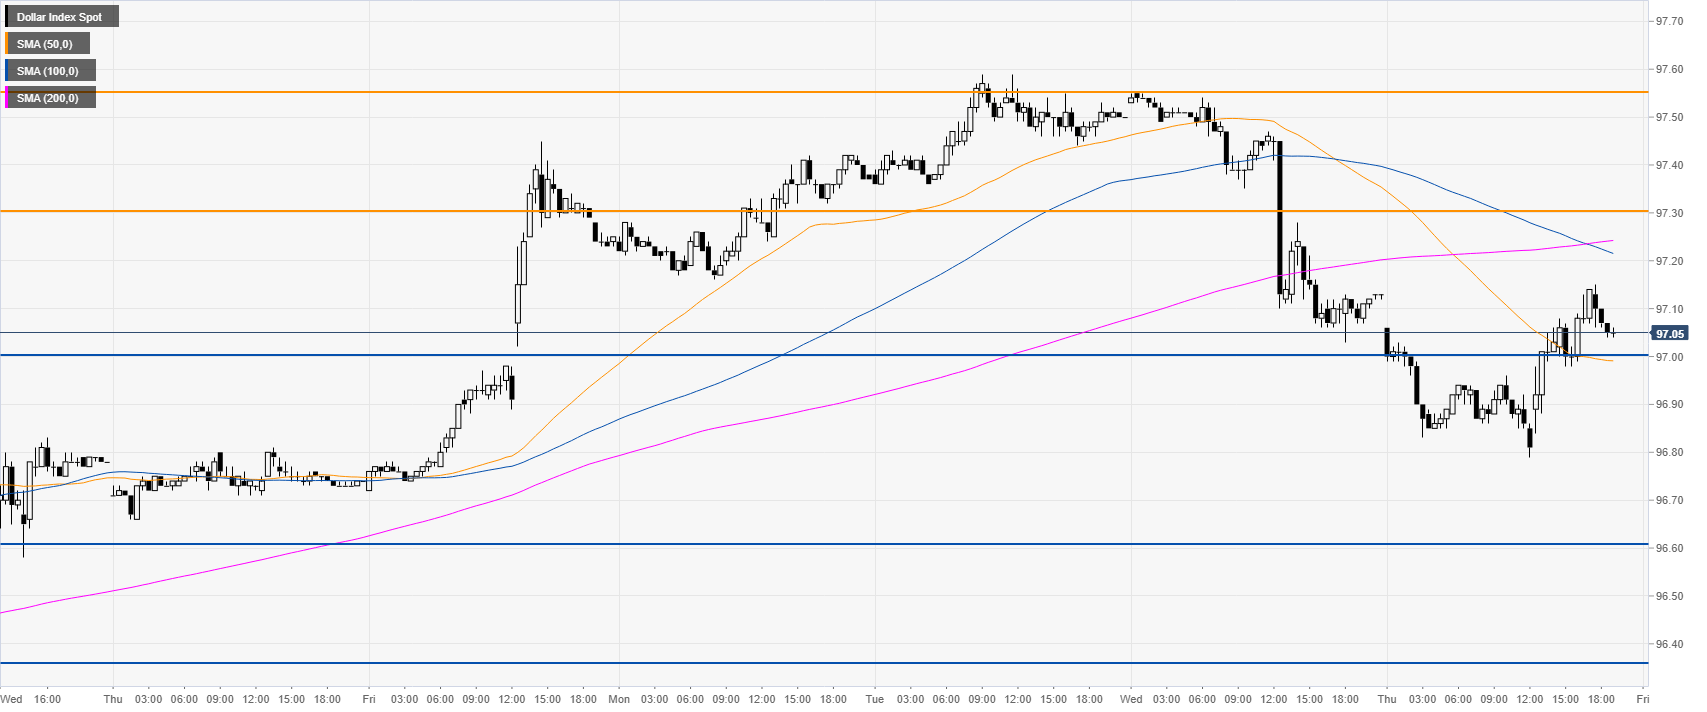
DXY 30-minute chart

The greenback snapped back up above 97.00 this Thursday. Bulls will try to reach 97.30 and 97.55 levels to the upside. The 100 SMA crossed below the 200 SMA (near 97.30) which is seen as bearish. The 97.30 resistance can become a tough nut to crack for bulls. 


Additional key levels

Dollar Index Spot

Overview
Today last price97.05
Today Daily Change-0.08
Today Daily Change %-0.08
Today daily open97.13
 
Trends
Daily SMA2096.85
Daily SMA5097.26
Daily SMA10097.13
Daily SMA20096.77
Levels
Previous Daily High97.55
Previous Daily Low97.03
Previous Weekly High97.45
Previous Weekly Low96.28
Previous Monthly High97.81
Previous Monthly Low95.84
Daily Fibonacci 38.2%97.23
Daily Fibonacci 61.8%97.35
Daily Pivot Point S196.92
Daily Pivot Point S296.72
Daily Pivot Point S396.4
Daily Pivot Point R197.44
Daily Pivot Point R297.76
Daily Pivot Point R397.96

Author

Flavio Tosti

Flavio Tosti

Independent Analyst


More from Flavio Tosti
Share:

Editor's Picks

EUR/USD stays well offered below 1.1800

The selling pressure on EUR/USD is picking up pace, with the pair slipping decisively below the key 1.1800 level and sliding to fresh two week lows as Wednesday’s session draws to a close. The move lower comes as the US Dollar finds renewed strength after the latest round of US data and the release of the FOMC Minutes. Next of note on the docket will be the US weekly Initial Jobless Claims.
 

GBP/USD reaches multi-day lows near 1.3500

GBP/USD reverses its initial upside momentum and is now adding to previous declines, approaching the 1.3500 region on Wednesday. Cable’s downtick comes on the back of decent gains in the Greenback and easing UK inflation figures, which seem to have reinforced the case for a BoE rate cut in March.

Gold battle to regain $5,000 continues

Gold is back on the front foot on Wednesday, shaking off part of the early week softness and challenging two-day highs near the $5,000 mark per troy ounce. The move comes ahead of the FOMC Minutes and is unfolding despite an intense rebound in the US Dollar.

Bitcoin has found or is near a bottom, extended consolidation to follow: K33

Bitcoin (BTC) is nearing or has already established a bottom, which could be followed by a sustained period of slow price movement, according to K33.

Mixed UK inflation data no gamechanger for the Bank of England

Food inflation plunged in January, but service sector price pressure is proving stickier. We continue to expect Bank of England rate cuts in March and June. The latest UK inflation read is a mixed bag for the Bank of England, but we doubt it drastically changes the odds of a March rate cut.

Sui extends sideways action ahead of Grayscale’s GSUI ETF launch

Sui is extending its downtrend for the second consecutive day, trading at 0.95 at the time of writing on Wednesday. The Layer-1 token is down over 16% in February and approximately 34% from the start of the year, aligning with the overall bearish sentiment across the crypto market.