|

US Dollar Index Technical Analysis: DXY rolling into Asia near multi-month’s highs
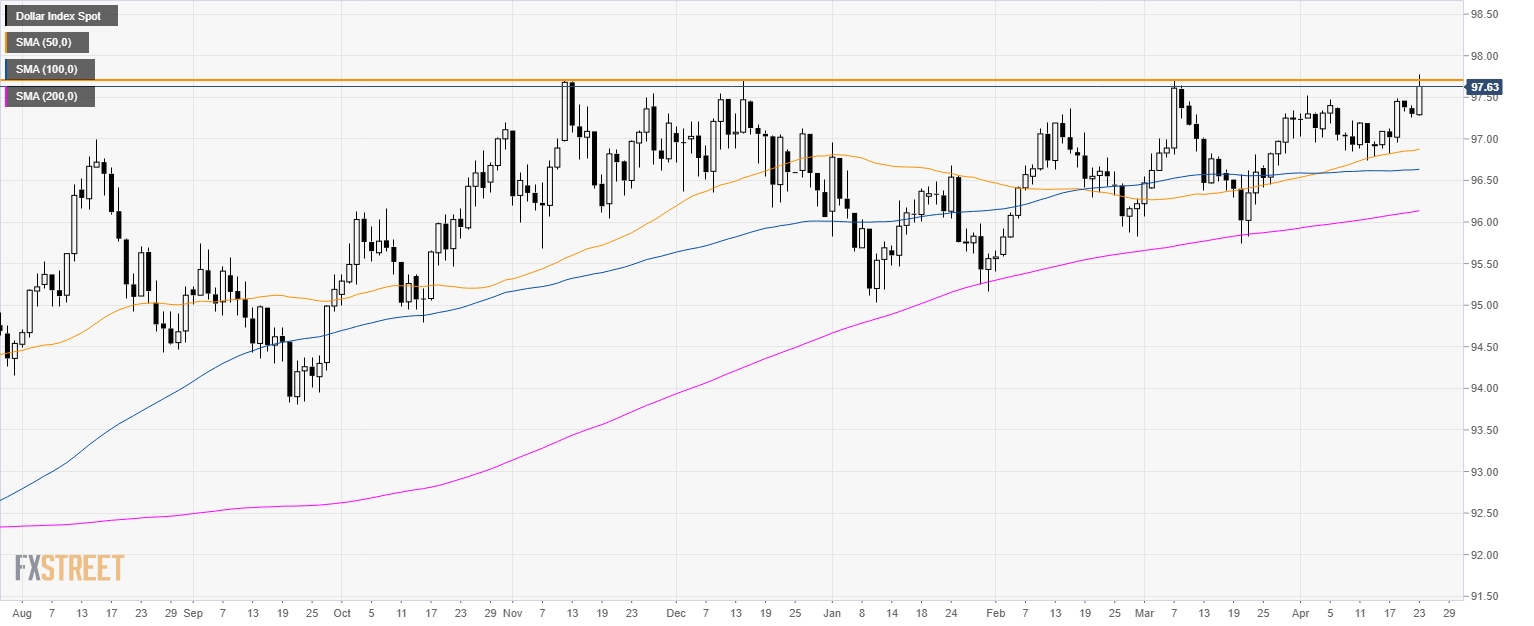
DXY daily chart

  • The US Dollar Index (DXY) is trading in a bull trend above its 200-day simple moving average (SMA).
  • DXY hit a new 2019 high at 97.78 during the North American session. 
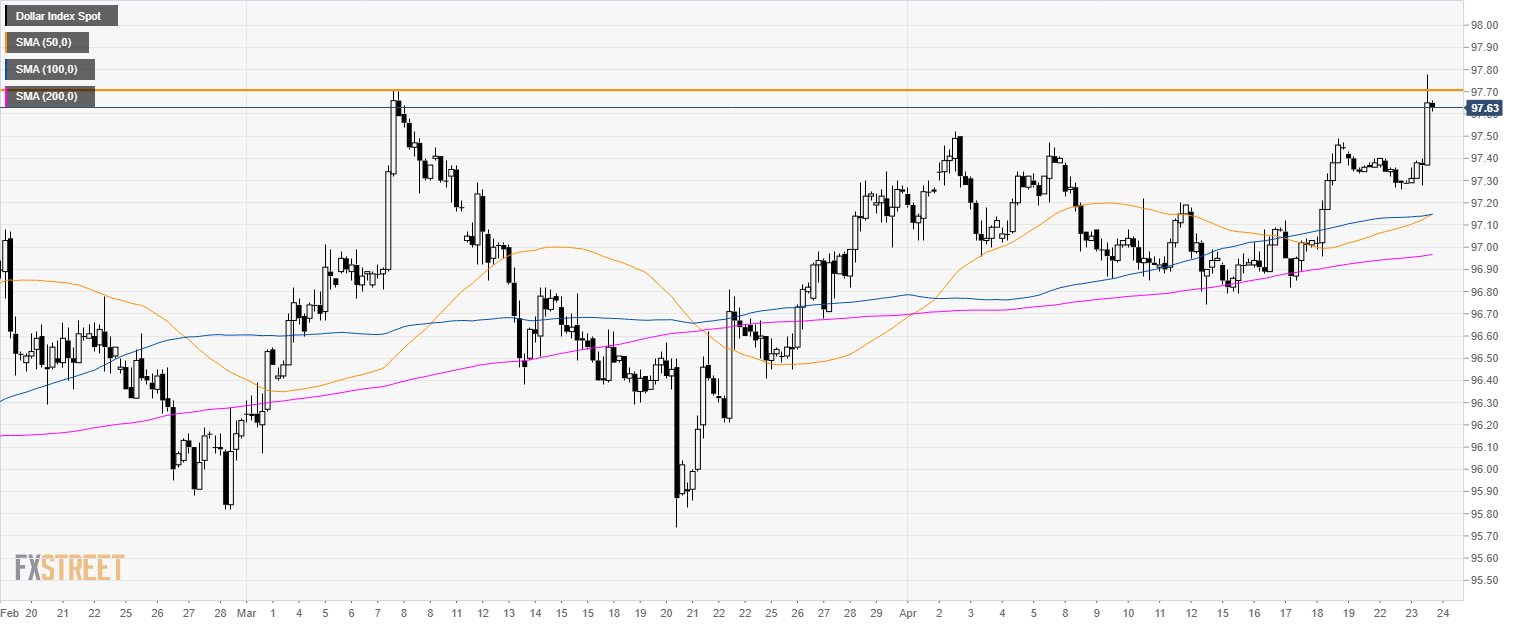
DXY 4-hour chart

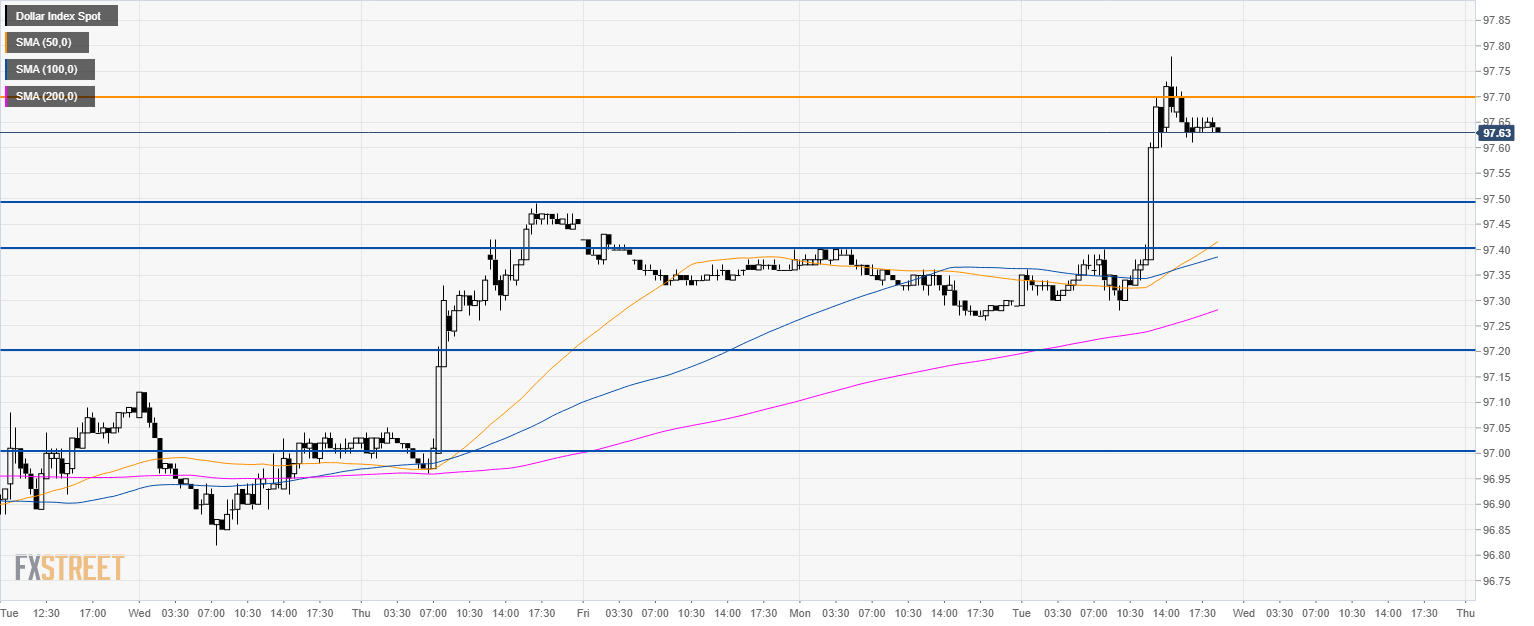
  • There is currently no acceptance above the 97.70 key resistance.

DXY 30-minute chart

  • The momentum is bullish however bulls will need a convincing breakout above 97.70 resistance. 
  • Failure to retake that price level would see the current up move as a bullish overaction exposing 97.50/40 support to the downside.
  • Alternatively, the bullish scenario would entail a break above 97.70 towards 98.00 and 98.50 resistances.

Additional key levels

Dollar Index Spot

Overview
Today last price97.61
Today Daily Change0.31
Today Daily Change %0.32
Today daily open97.3
 
Trends
Daily SMA2097.15
Daily SMA5096.86
Daily SMA10096.63
Daily SMA20096.12
Levels
Previous Daily High97.4
Previous Daily Low97.26
Previous Weekly High97.49
Previous Weekly Low96.79
Previous Monthly High97.71
Previous Monthly Low95.74
Daily Fibonacci 38.2%97.31
Daily Fibonacci 61.8%97.35
Daily Pivot Point S197.24
Daily Pivot Point S297.18
Daily Pivot Point S397.1
Daily Pivot Point R197.38
Daily Pivot Point R297.46
Daily Pivot Point R397.52

Author

Flavio Tosti

Flavio Tosti

Independent Analyst


More from Flavio Tosti
Share:

Editor's Picks

EUR/USD keeps the rangebound trade near 1.1850

EUR/USD is still under pressure, drifting back towards the 1.1850 area as Monday’s session draws to a close. The modest decline in spot comes as the US Dollar picks up a bit of support, while thin liquidity and muted volatility, thanks to the US market holiday, are exaggerating price swings and keeping trading conditions choppy.
 

GBP/USD flirts with daily lows near 1.3630

GBP/USD has quickly given back Friday’s solid gains, turning lower at the start of the week and drifting back towards the 1.3630 area. The focus now shifts squarely to Tuesday’s UK labour market report, which is likely to keep the quid firmly in the spotlight and could set the tone for Cable’s next move.

Gold battle around $5,000 continues

Gold is giving back part of Friday’s sharp rebound, deflating below the key $5,000 mark per troy ounce as the new week gets underway. Modest gains in the US Dollar are keeping the metal in check, while thin trading conditions, due to the Presidents Day holiday in the US, are adding to the choppy and hesitant tone across markets.

AI Crypto Update: Bittensor eyes breakout as AI tokens falter 

The artificial intelligence (AI) cryptocurrency segment is witnessing heightened volatility, with top tokens such as Near Protocol (NEAR) struggling to gain traction amid the persistent decline in January and February.

The week ahead: Key inflation readings and why the AI trade could be overdone

It is likely to be a quiet start to the week, with US markets closed on Monday for Presidents Day. European markets are higher across the board and gold is clinging to the $5,000 level after the tamer than expected CPI report in the US reduced haven flows to precious metals.

XRP steadies in narrow range as fund inflows, futures interest rise

Ripple is trading in a narrow range between $1.45 (immediate support) and $1.50 (resistance) at the time of writing on Monday. The remittance token extended its recovery last week, peaking at $1.67 on Sunday from the weekly open at $1.43.