|
US Dollar Index technical analysis: DXY recovers on Friday as bulls lift the matket above the 97.00 handle
- DXY erased Thursday’s losses and regained the 97.00 handle.
- The level to beat for bulls are at 97.30 and 97.55.
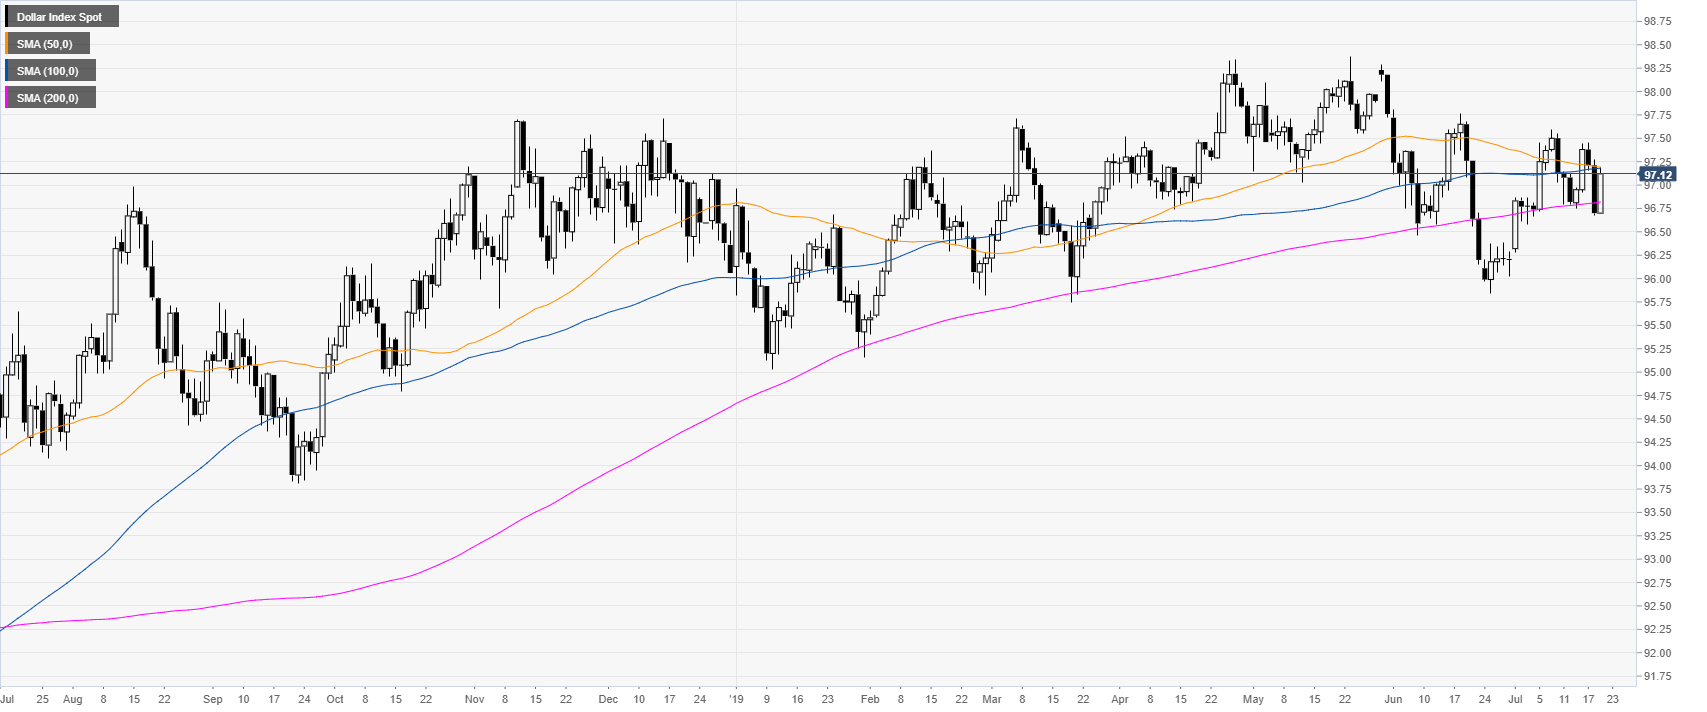
DXY daily chart
The US Dollar Index (DXY) rebouned near the 200-daily simple moving average (DSMA) as the market is trading above the 97.00 handle. The market is finding resistance near 97.15 where lie the 50 and 100 DSMAs.

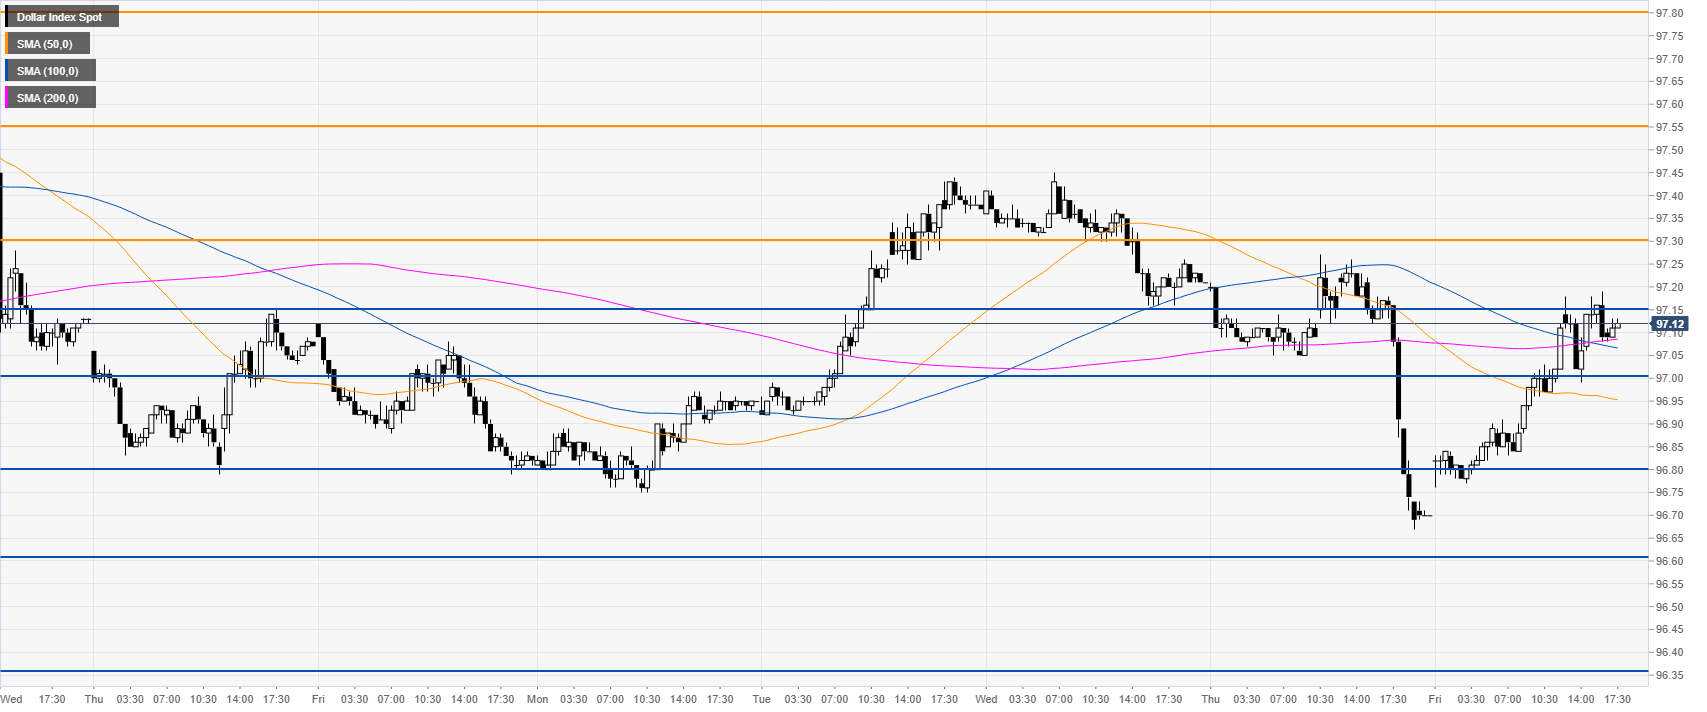
DXY 4-hour chart
DXY is challenging the 90.15 resistance as it is trading above its main SMAs. 97.30 and the 97.55 resistances are the main hurdles to the upside.


DXY 30-minute chart
The market is trading above its main SMAs suggesting bullish momentum in the near term. Immediate support is seen at the 97.00 and 96.80 level.
Additional key levels
Author

Flavio Tosti
Independent Analyst
More from Flavio Tosti


