|

US Dollar Index technical analysis: DXY is off daily lows, rebounding from 98.20 level

  • The Greenback erased the gains made on Wednesday after the Fed cut rates.
  • DXY (US Dollar Index) is trapped in a two-week range.
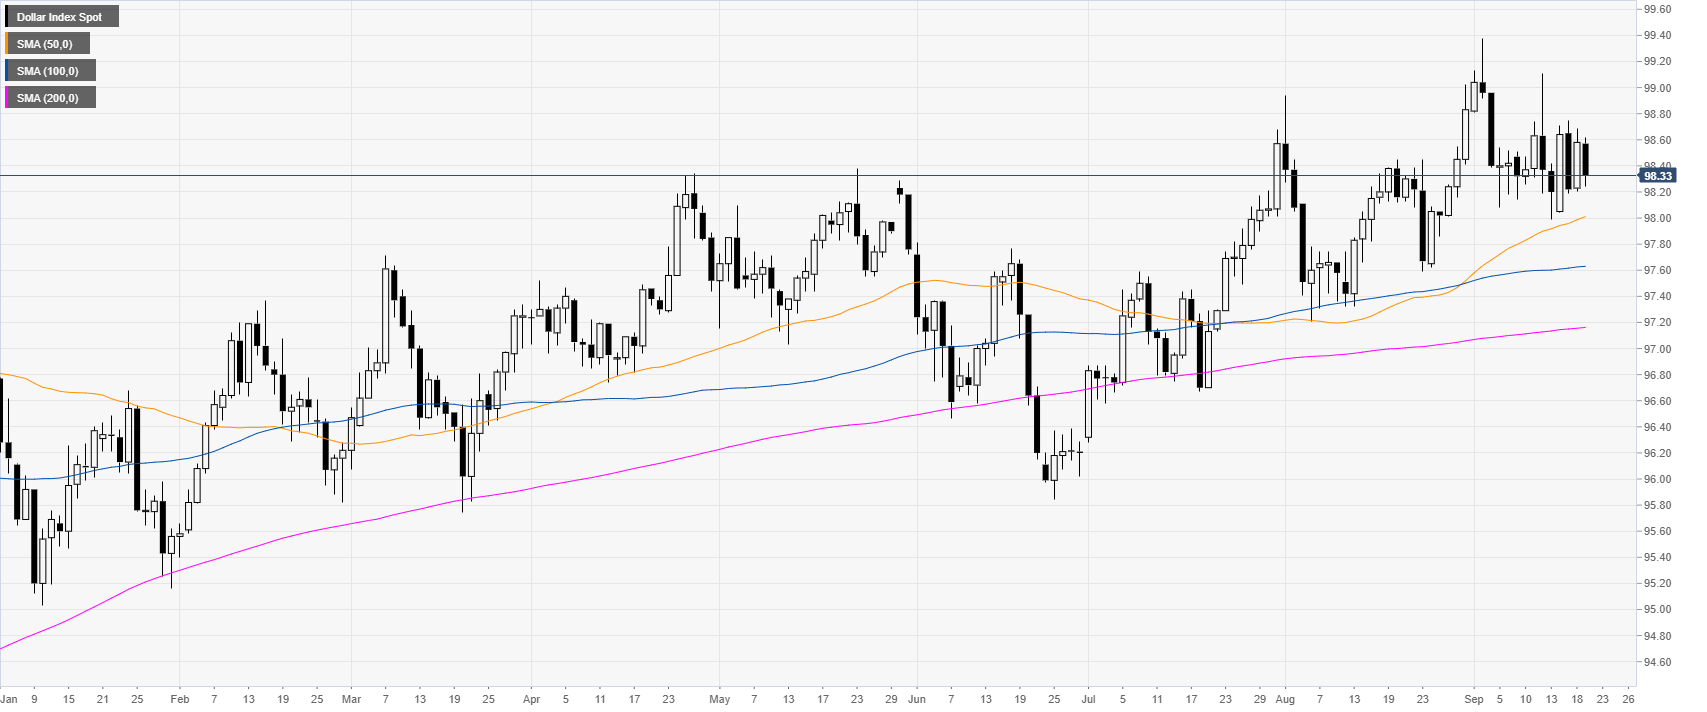
 

DXY daily chart


DXY (US Dollar Index) is trading in a bull trend above the main daily simple moving averages (DSMAs). However, the Greenback has been trading in a trading range in the last two weeks. On Wednesday, the Fed cut 25 bps as it was widely expected but from a technical perspective, nothing as substantially changed.
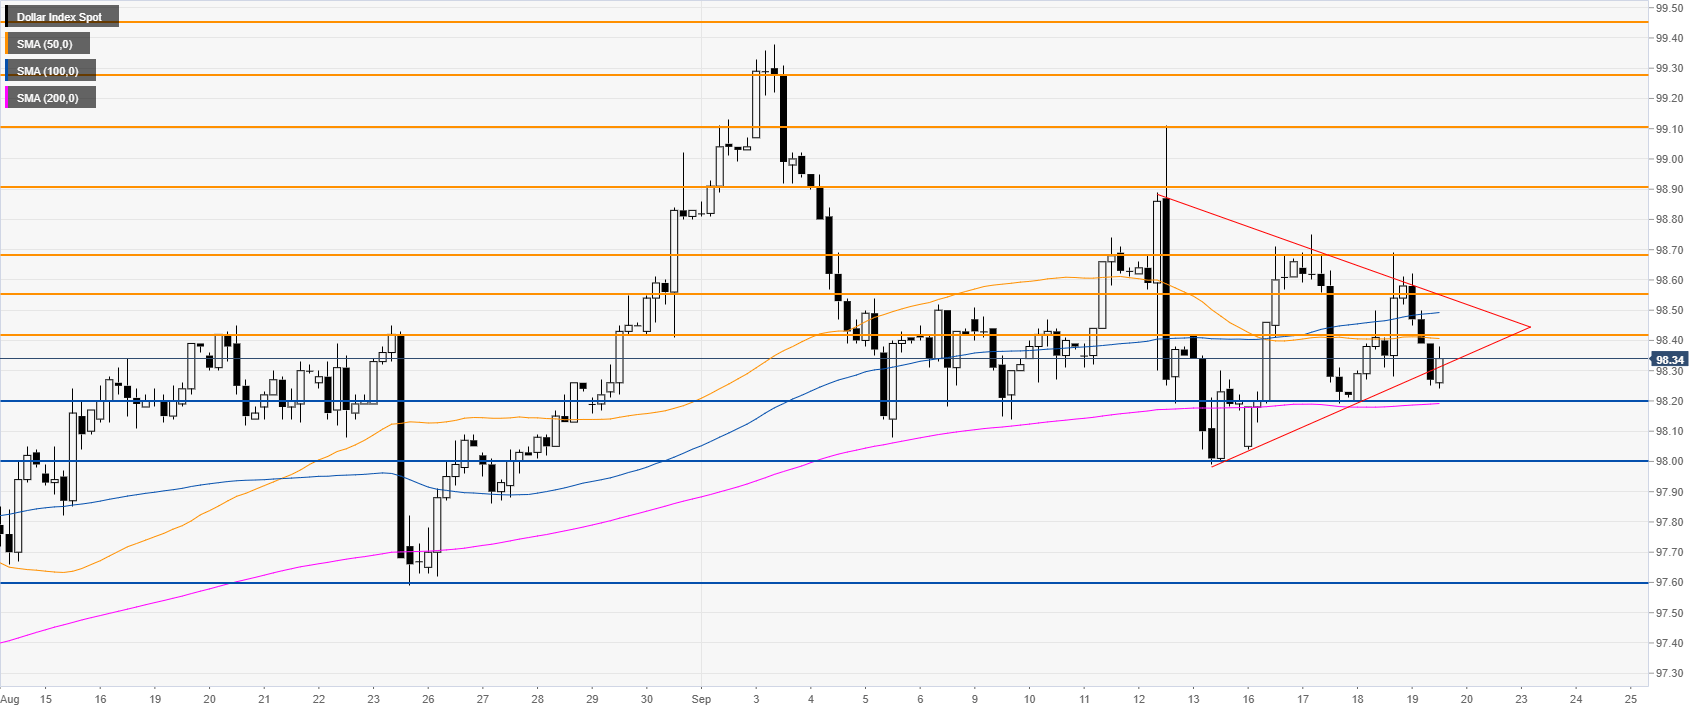
 

DXY four-hour chart

 
DXY is in a range above the 98.20 support and the 200 SMA. There is little directional bias as the range is getting nearer and nearer. Arguably DXY is also forming a triangle pattern with a potential breakout in either direction. 
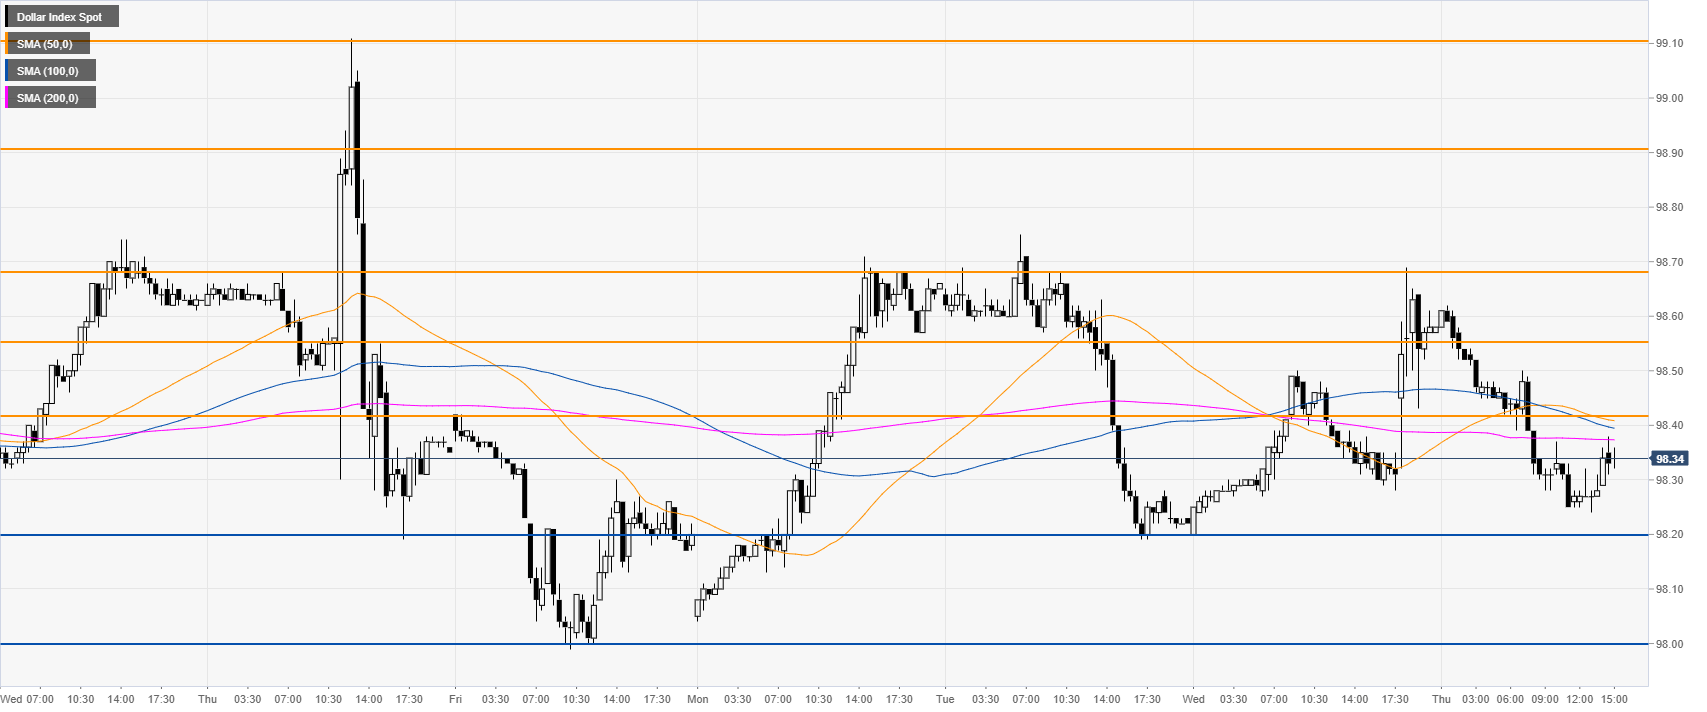
 

DXY 30-minute chart

 
DXY was quick to erase the Fed’s inspired spike seen on Wednesday. The market is bouncing from the 98.20 level. Foe any meaningful move to happen, bulls would need a break above the 98.68 resistance while bears would need to clear the 98.00 support.

Additional key levels

Dollar Index Spot

Overview
Today last price98.34
Today Daily Change-0.24
Today Daily Change %-0.24
Today daily open98.58
 
Trends
Daily SMA2098.4
Daily SMA5097.99
Daily SMA10097.63
Daily SMA20097.16
 
Levels
Previous Daily High98.69
Previous Daily Low98.2
Previous Weekly High99.11
Previous Weekly Low97.99
Previous Monthly High99.02
Previous Monthly Low97.21
Daily Fibonacci 38.2%98.5
Daily Fibonacci 61.8%98.39
Daily Pivot Point S198.29
Daily Pivot Point S298
Daily Pivot Point S397.8
Daily Pivot Point R198.78
Daily Pivot Point R298.98
Daily Pivot Point R399.27

Author

Flavio Tosti

Flavio Tosti

Independent Analyst


More from Flavio Tosti
Share:

Editor's Picks

EUR/USD meets initial support around 1.1800

EUR/USD remains on the back foot, although it has managed to reverse the initial strong pullback toward the 1.1800 region and regain some balance, hovering around the 1.1850 zone as the NA session draws to a close on Tuesday. Moving forward, market participants will now shift their attention to the release of the FOMC Minutes and US hard data on Wednesday.
 

GBP/USD bounces off lows, retargets 1.3550

After bottoming out just below the 1.3500 yardstick, GBP/USD now gathers some fresh bids and advances to the 1.3530-1.3540 band in the latter part of Tuesday’s session. Cable’s recovery comes as the Greenback surrenders part of its advance, although it keeps the bullish bias well in place for the day.

Gold remains offered below $5,000

Gold stays on the defensive on Tuesday, receding to the sub-$5,000 region per troy ounce on the back of the persistent move higher in the Greenback. The precious metal’s decline is also underpinned by the modest uptick in US Treasury yields across the spectrum.

Ethereum Price Forecast: BitMine extends ETH buying streak, says long-term outlook remains positive

Ethereum (ETH) treasury firm BitMine Immersion continued its weekly purchase of the top altcoin last week after acquiring 45,759 ETH.

UK jobs market weakens, bolstering rate cut hopes

In the UK, the latest jobs report made for difficult reading. Nonetheless, this represents yet another reminder for the Bank of England that they need to act swiftly given the collapse in inflation expected over the coming months. 

Ripple slides to $1.45 as downside risks surge

Ripple edges lower at the time of writing on Tuesday, from the daily open of $1.48, as headwinds persist across the crypto market. A short-term support is emerging at $1.45, but a buildup of bearish positions could further weaken the derivatives market and prolong the correction.