|
US Dollar Index technical analysis: DXY gathers bullish momentum and reaches 97.55 resistance
- DXY broke significantly higher on Friday reaching 97.55 resistance.
- Bulls have regained control and seem to be en route towards the 2019 high at 98.37.

DXY daily chart
The US Dollar Index (DXY) is in a bull trend above its main daily simple moving averages (DSMA).

DXY 4-hour chart
DXY is trading above its main SMAs suggesting bullish strength. The market reached 97.55 resistance mentioned on Thursday.

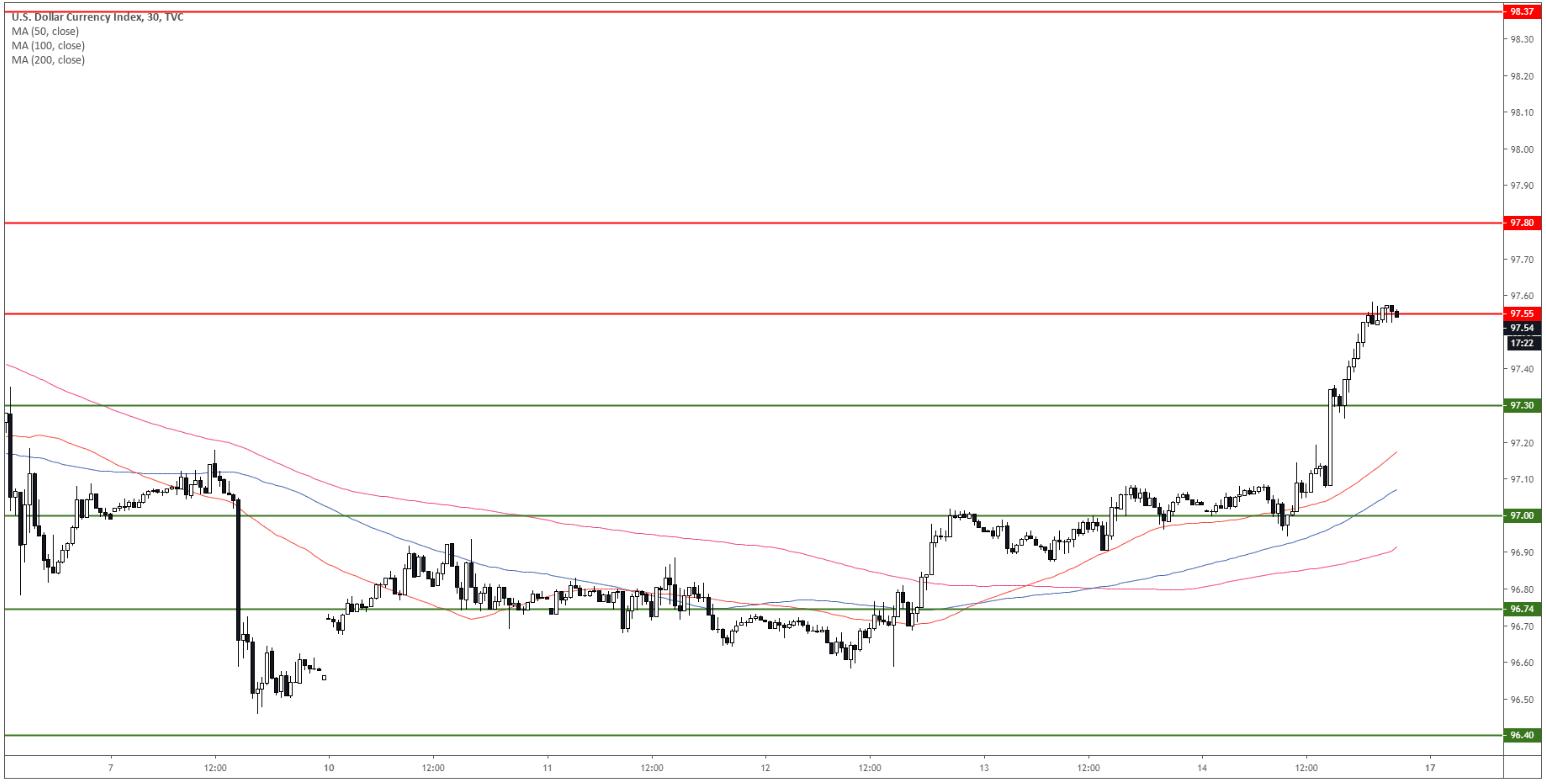
DXY 30-minute chart
The greenback is above its main SMAs suggesting bullish momentum in the near term. The market may continue to rise towards 97.80 and 98.37 resistances. Support is at 97.30 and 97.00
Additional key levels
Author

Flavio Tosti
Independent Analyst
More from Flavio Tosti


