|

US Dollar Index Technical Analysis: DXY drops sharply as Fed’s Powell delivers dovish comments

DXY daily chart 

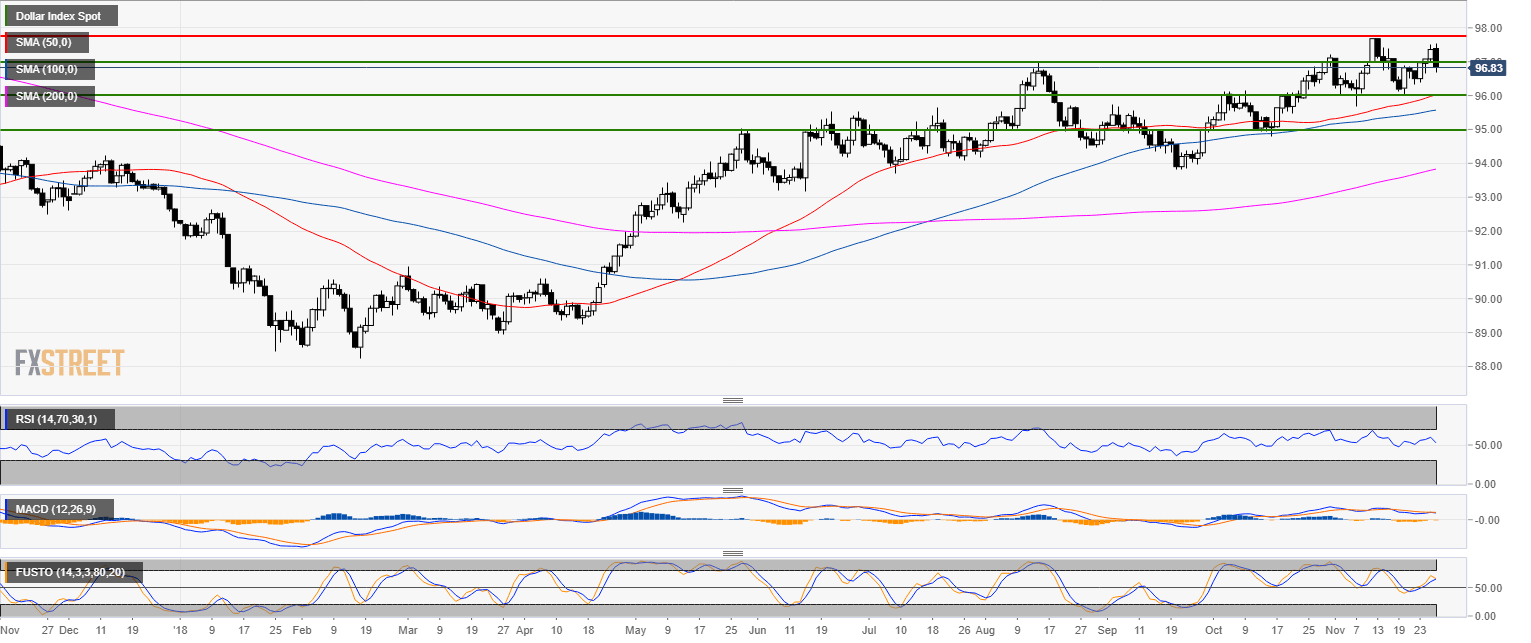
  • The US Dollar Index (DXY) is trading in a bull trend above its main simple moving averages. 
  • Today’s down move was triggered by dovish comments from Fed’s Powell. 
  • Bears are set to close below the 97.00 psychological level as technical indicators are decelerating.
DXY 4-hour chart

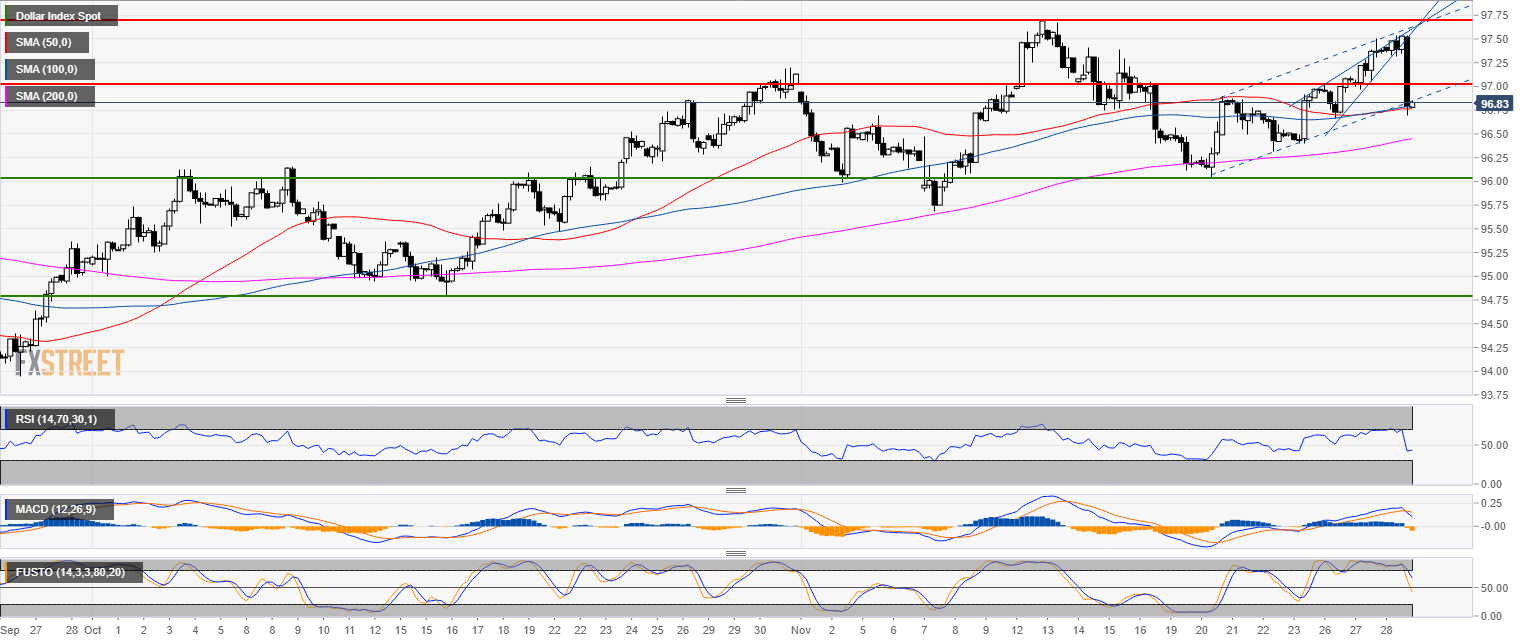
  • DXY plunged down to find some support at the 50 SMA. 
  • 97.00 and 97.25 become the new resistances. 
  • Technical indicators have turned bearish suggesting potential losses ahead.
DXY 30-minute chart

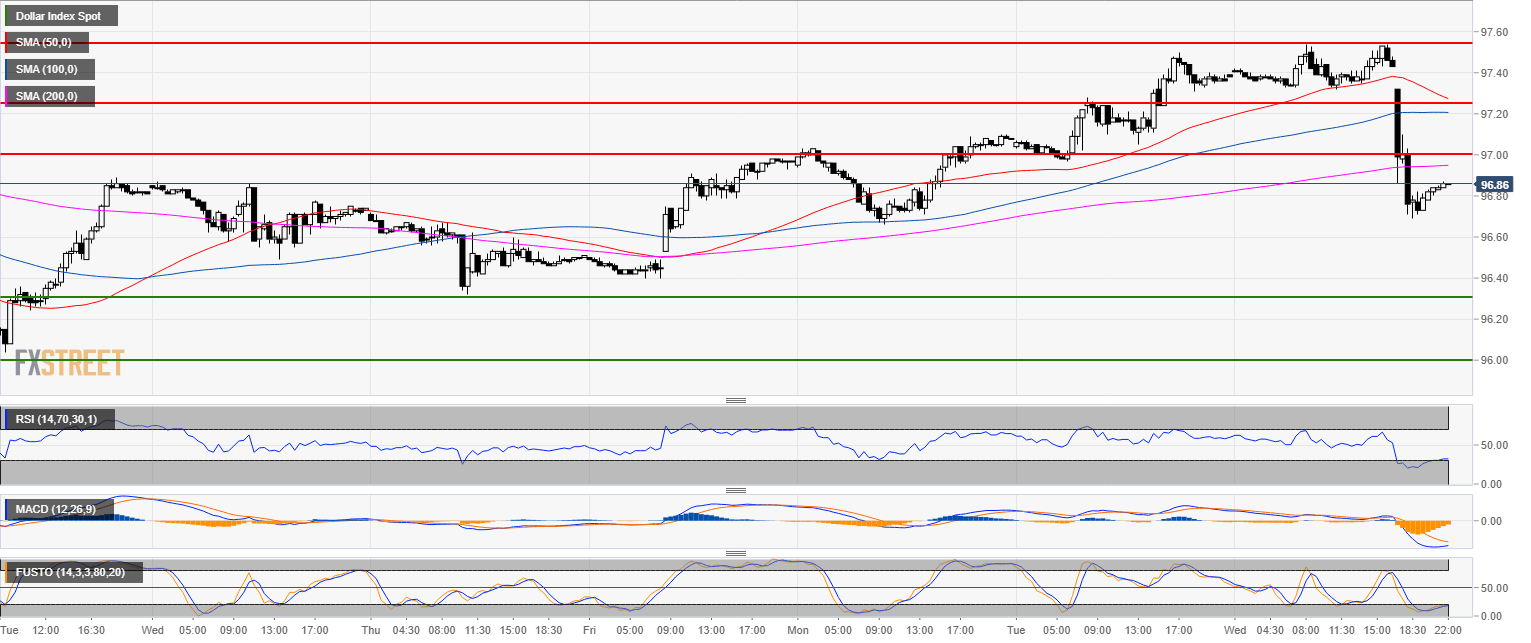
  • After the fresh sell-off, there can be a pullback up to 97.00 as the market might want to test the 200 SMA and the round number. 
  • If the bears keep the momentum going the next main target to the downside is likely located near the 96.30 level. 
Additional key levels

Dollar Index Spot

Overview:
    Today Last Price: 96.86
    Today Daily change: -50 pips
    Today Daily change %: -0.514%
    Today Daily Open: 97.36
Trends:
    Previous Daily SMA20: 96.76
    Previous Daily SMA50: 95.98
    Previous Daily SMA100: 95.55
    Previous Daily SMA200: 93.79
Levels:
    Previous Daily High: 97.5
    Previous Daily Low: 96.97
    Previous Weekly High: 96.98
    Previous Weekly Low: 96.04
    Previous Monthly High: 97.2
    Previous Monthly Low: 94.79
    Previous Daily Fibonacci 38.2%: 97.3
    Previous Daily Fibonacci 61.8%: 97.17
    Previous Daily Pivot Point S1: 97.05
    Previous Daily Pivot Point S2: 96.75
    Previous Daily Pivot Point S3: 96.52
    Previous Daily Pivot Point R1: 97.58
    Previous Daily Pivot Point R2: 97.81
    Previous Daily Pivot Point R3: 98.11

Author

Flavio Tosti

Flavio Tosti

Independent Analyst

 

More from Flavio Tosti
Share:

Editor's Picks

GBP/USD eases toward 1.3500 on geopolitical tensions, hawkish Fed bets

GBP/USD trades with mild losses below 1.3550 in the European session. The US Dollar recovers some ground amid ongoing Middle East tensions and hawkish expectations around the Fed's interest rate outlook, weighing on the pair ahead of US data releases.

EUR/USD stays below 1.1600 after mixed Eurozone inflation data

EUR/USD struggles to capitalize on the overnight bounce and trades below 1.1600 in the European session on Tuesday. The data from the Eurozone showed that the annual HICP inflation rose to 3.3% in August from 2.9% in July, matching the market expectation, while the core HICP inflation edged lower to 2.4% from 2.5% in this period. In the second half of the day, JOLTS Job Openings and ISM Manufacturing PMI data will be featured in the US economic calendar.

Gold drops to nearly two-week low, below $4,400 on hawkish Fed bets and firm USD

Gold weakens further below the $4,400 mark, hitting a nearly two-week low during the first half of the European session. Traders ramped up bets for a rate hike in September following Federal Reserve Chair Kevin Warsh's remarks last Friday.

Ripple, Cardano, and Dogecoin show weakness – Crucial EMAs in focus

Ripple, Cardano, and Dogecoin remain weak after double-digit losses last week, testing their crucial Exponential Moving Averages for immediate support. The technical outlook warns of further weakness in the prices of XRP, ADA, and DOGE as bullish momentum eases.

ISM Manufacturing PMI set to signal steady expansion in US factory activity

Attention shifts to Tuesday’s release of the August ISM Manufacturing Purchasing Managers Index, one of the most closely followed indicators of activity in the US manufacturing sector and an important barometer of the broader economy. Markets expect the headline index to worsen a tad to 55.2 in August.

Diesel’s record $100 warning: The oil shock hiding in plain sight

The Oil market may look calmer than it did a few months ago, but diesel is sending a very different message. The US diesel crack spread, the premium of ultra-low sulphur diesel futures over WTI, recently surged above $100 per barrel for the first time, reaching an intraday record of just over $102.00.
















