|
US Dollar Index technical analysis: DXY bulls en route to 97.74 price level

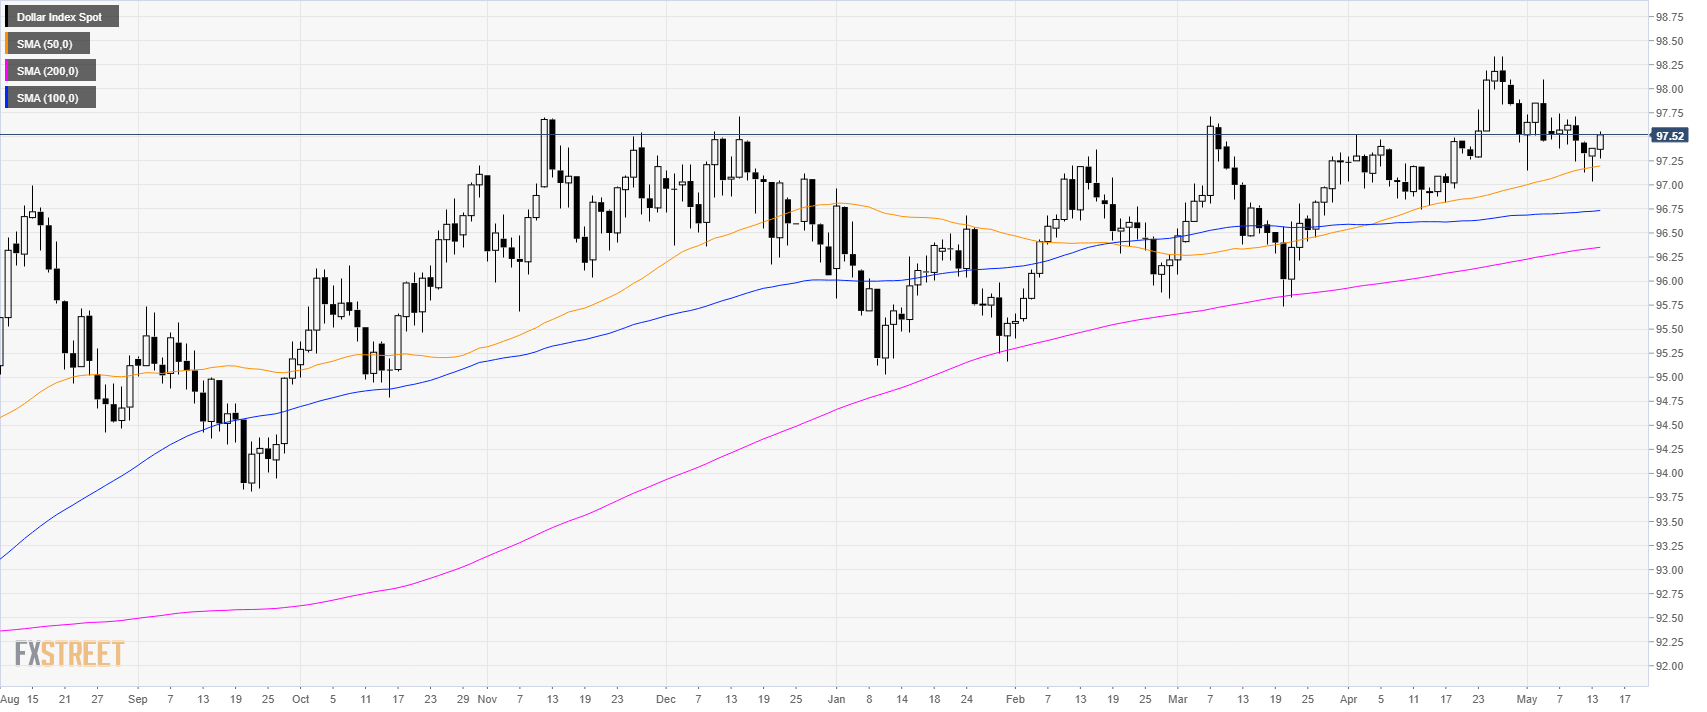
DXY daily chart
The US Dollar Index (DXY) is trading in a bull trend above its main simple moving averages (SMAs).The index picked up some steam this Tuesday as the market is trading just above the 97.50 level.
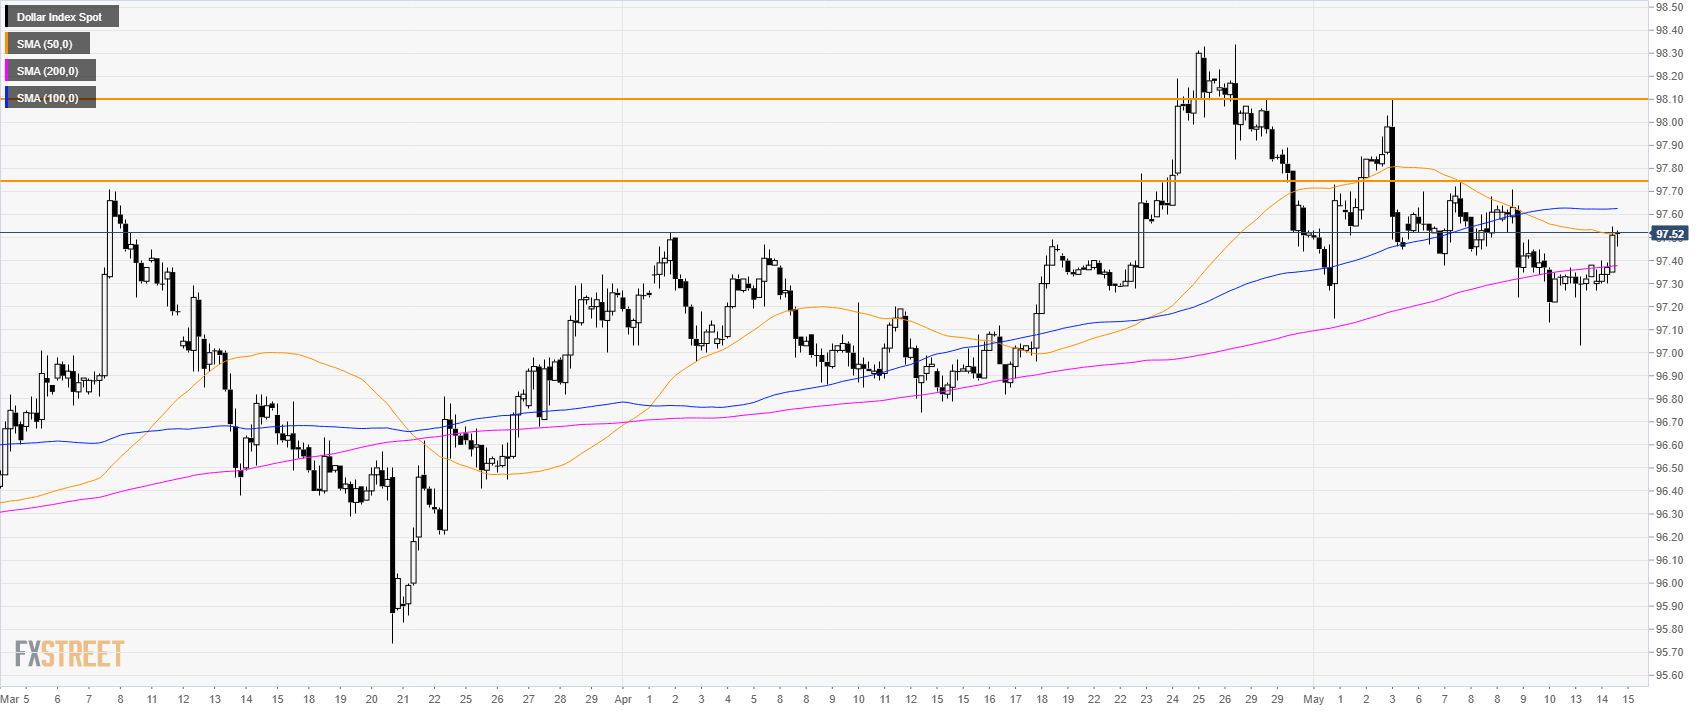
DXY 4-hour chart
The market regained the 200 SMA and is now challenging the 50 SMA at 97.51. There is room for a move up to 97.74 and potentially to 98.10 resistances.
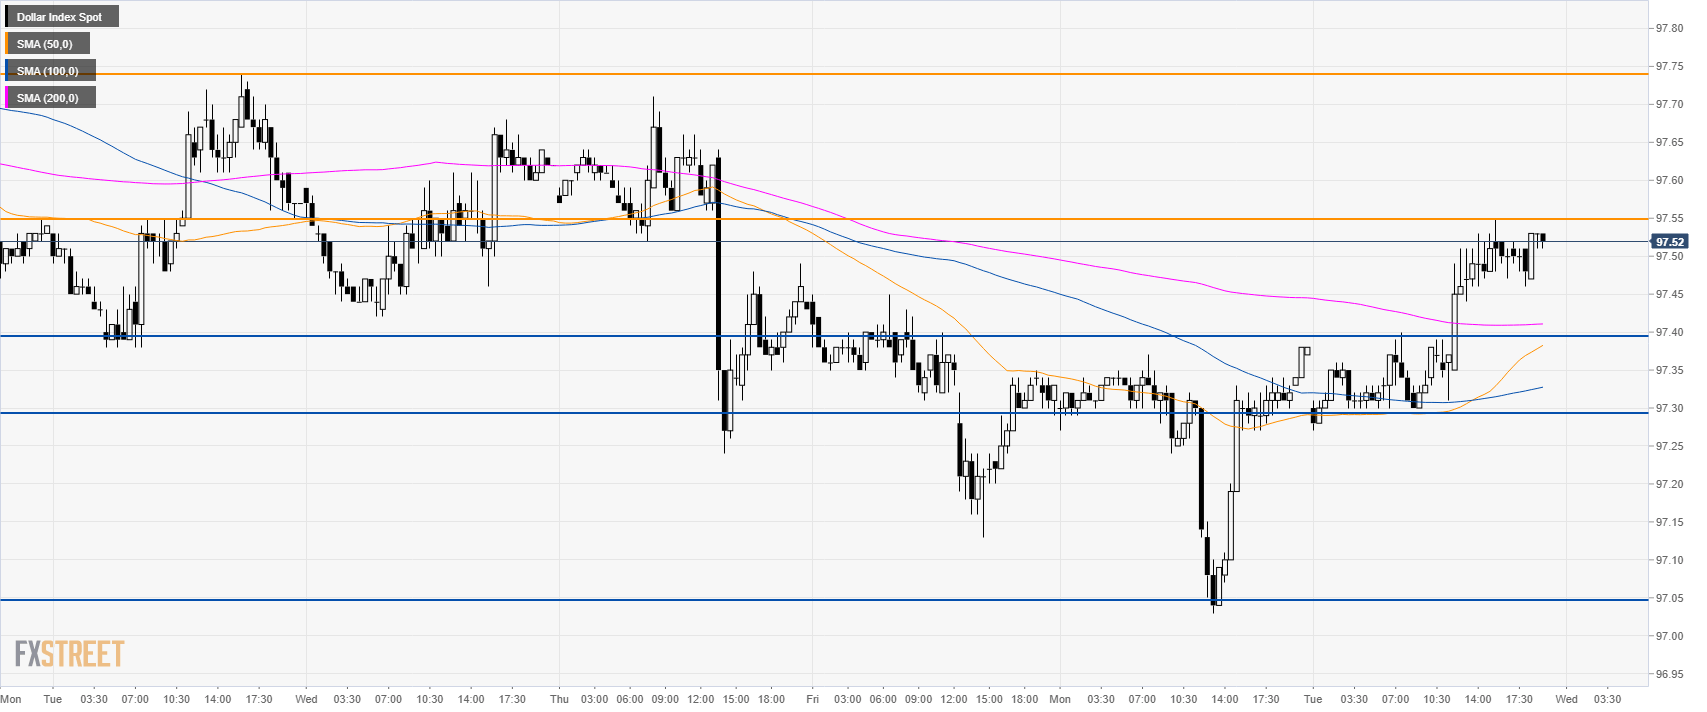
DXY 30-minute chart
Bulls created a new leg up after the v-shaped reversal seen on Monday. The market is trading above its main SMAs suggesting bullish momentum in the short term. A break above 97.55 resistance can lead to 97.74 price level to the upside. Support is at 97.40/30 and 97.05 level.
Additional key levels
Author

Flavio Tosti
Independent Analyst
More from Flavio Tosti


