|

US Dollar Index Technical Analysis: DXY approaching critical resistance at the 98.50 level

  • DXY is grinding higher on the first day of the week.
  • The level to beat for buyers is the 98.50 price level. 
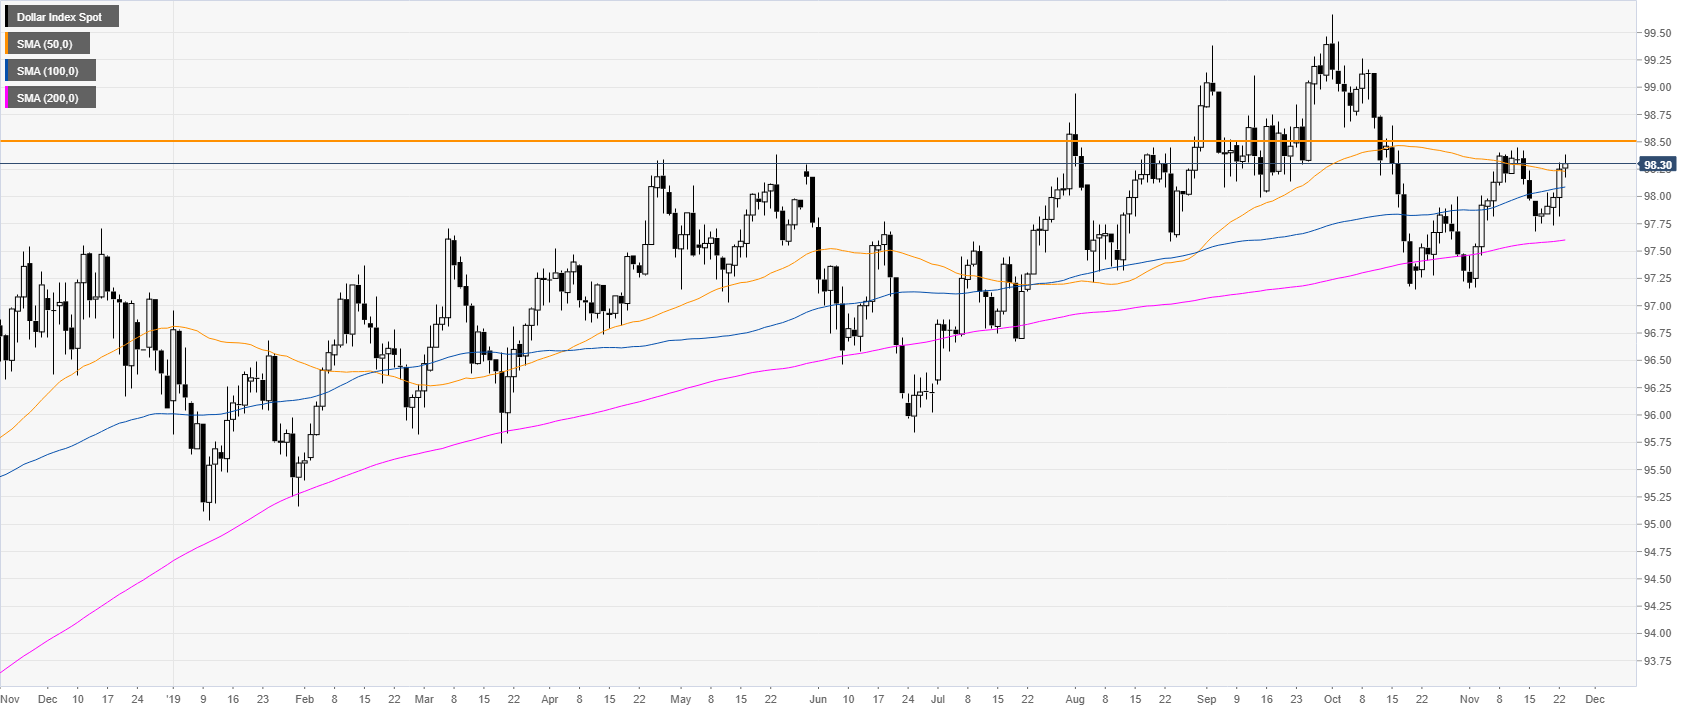


DXY daily chart

 
DXY (US Dollar Index) is trading in an uptrend above the main daily simple moving averages (DMAs). This Monday, DXY is trading mixed hanging near the November highs. The market is nearing an important resistance at the 98.50 level. 
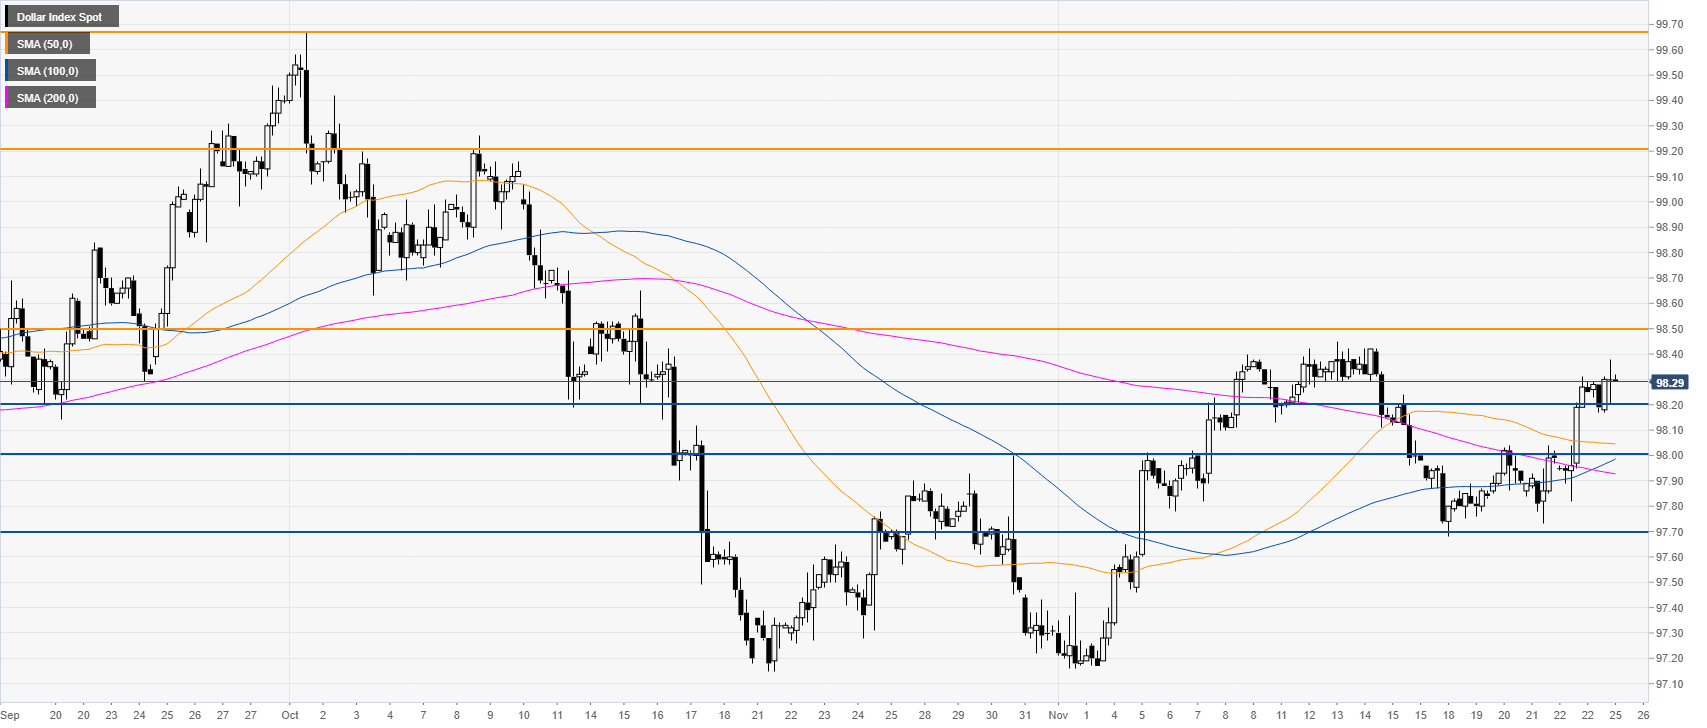
 

DXY 4-hour chart

 
DXY is evolving above the main SMAs, suggesting a bullish bias in the medium term. If the buyers overcome the 98.50 level, the market is set to accelerate towards the 99.20 level and possibly to the 99.67 level (2019 high). 
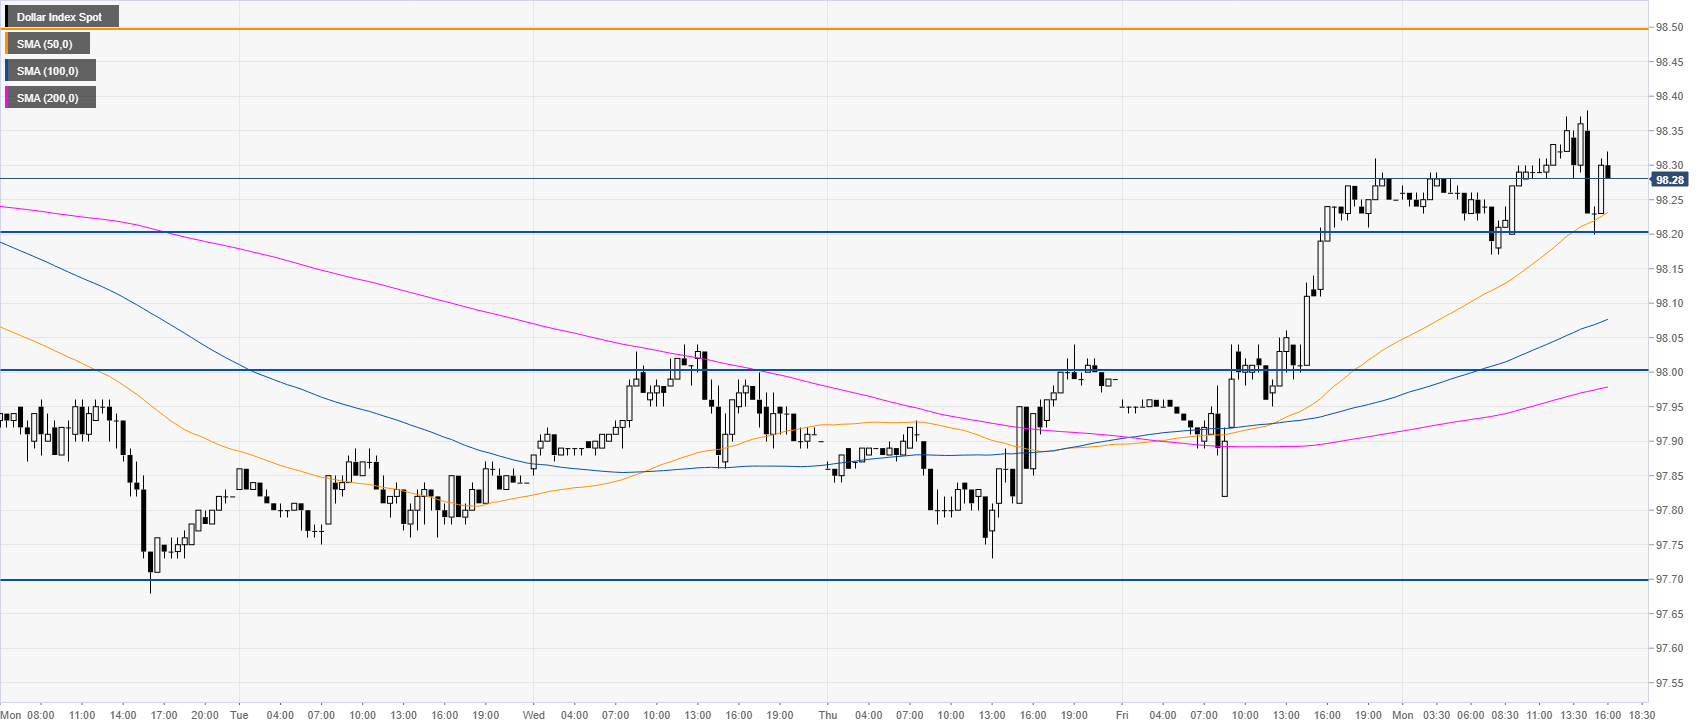
     

DXY 30-minute chart


The index is trading above the main SMAs, suggesting a bullish bias in the near term. Support is seen at the 98.20 and 98.00 price levels. 
 

Additional key levels

Dollar Index Spot

Overview
Today last price98.3
Today Daily Change0.05
Today Daily Change %0.05
Today daily open98.25
 
Trends
Daily SMA2097.91
Daily SMA5098.24
Daily SMA10098.08
Daily SMA20097.59
 
Levels
Previous Daily High98.31
Previous Daily Low97.82
Previous Weekly High98.31
Previous Weekly Low97.68
Previous Monthly High99.67
Previous Monthly Low97.15
Daily Fibonacci 38.2%98.12
Daily Fibonacci 61.8%98.01
Daily Pivot Point S197.94
Daily Pivot Point S297.64
Daily Pivot Point S397.45
Daily Pivot Point R198.43
Daily Pivot Point R298.62
Daily Pivot Point R398.92

Author

Flavio Tosti

Flavio Tosti

Independent Analyst


More from Flavio Tosti
Share:

Editor's Picks

EUR/USD loses ground below 1.1850 ahead of FOMC Minutes

The EUR/USD pair loses traction near 1.1840 during the early European session on Wednesday, pressured by renewed US Dollar demand. Traders brace for the Federal Open Market Committee Minutes for signals on future rate cuts, which will be released later on Wednesday. 

When is the UK CPI data and how could it affect GBP/USD?

The United Kingdom Consumer Price Index data for January is scheduled to be published today at 07:00 GMT. GBP/USD trades slightly lower at around 1.3556 as of writing. The 20-period Exponential Moving Average trends lower at 1.3593 and continues to cap rebounds. Price holds beneath this gauge, maintaining a short-term bearish bias.

Gold: Is the $5,000 level back in sight?

Gold snaps a two-day downtrend, as recovery gathers traction toward $5,000 on Wednesday. The US Dollar recovers from the overnight sell-off as rebalancing trades resume ahead of Fed Minutes. The 38.2% Fib support holds on the daily chart for now. What does that mean for Gold?

Pi Network rally defies market pressure ahead of its first anniversary

Pi Network is trading above $0.1900 at press time on Wednesday, extending the weekly gains by nearly 8% so far. The steady recovery is supported by a short-term pause in mainnet migration, which reduces pressure on the PI token supply for Centralized Exchanges. The technical outlook focuses on the $0.1919 resistance as bullish momentum increases.

UK jobs market weakens, bolstering rate cut hopes

In the UK, the latest jobs report made for difficult reading. Nonetheless, this represents yet another reminder for the Bank of England that they need to act swiftly given the collapse in inflation expected over the coming months. 

Top 3 Price Prediction: Bitcoin, Ethereum, and Ripple face downside risk as bears regain control

Bitcoin, Ethereum, and Ripple remain under pressure on Wednesday, with the broader trend still sideways. BTC is edging below $68,000, nearing the lower consolidating boundary, while ETH and XRP also declined slightly, approaching their key supports.