|

US Dollar Index reverses Friday's gains, plunges into 106.00

  • The US Dollar Index has gone full reverse in Friday trading following a forecast-busting NFP release.
  • The DXY pegged a new low for the week after dropping away from 107.00.
  • Market sentiment has twisted the throttle on risk appetite to close out the trading week, piling out of safe havens.

The US Dollar Index (DXY) tumbled in Friday trading after briefly reclaiming the 107.00 handle, sagging into a fresh low for the week at 105.95.

US Non-Farm Payrolls (NFP) figures on Friday handily beat forecasts, adding 336K jobs in September, well above the forecast decline to 170K and surging above the previous month's reading of 227K (revised upwards from 178K).

US Nonfarm Payrolls soar by 336,000 in September vs. 170,000 forecast

Inflation remains a firmly sticky thorn in the Federal Reserve's (Fed) side, and ongoing inflationary pressure is making market participants nervous that the Fed will have no choice but to keep interest rates higher for longer.

US: All eyes will be on inflation data – RBC

Forex Today: US data sustains Dollar strength, focus shifts to inflation

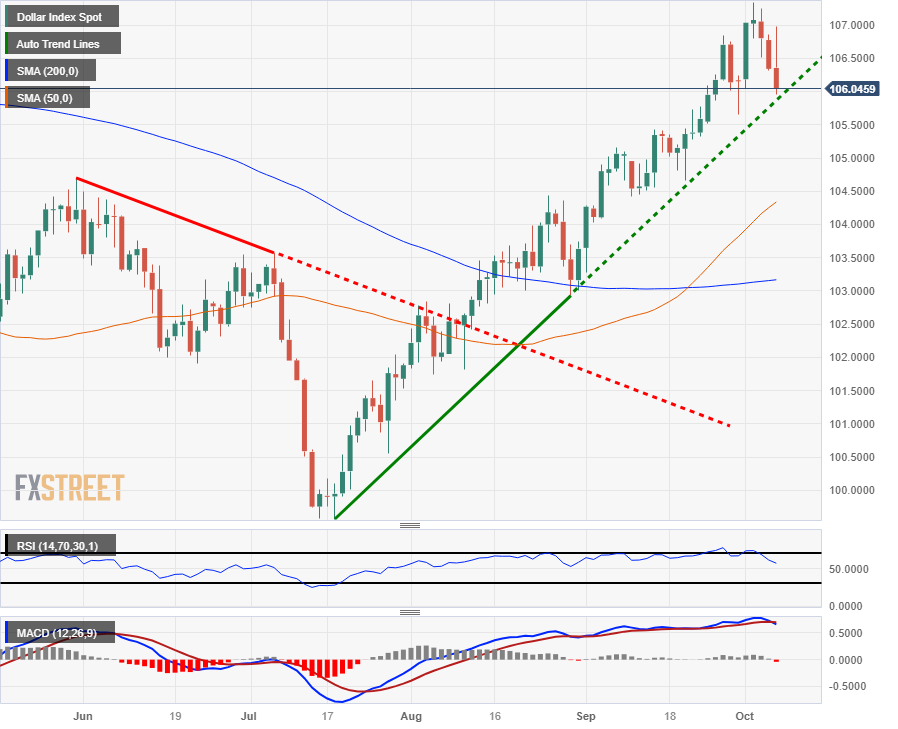
Dollar Index technical outlook

The US Dollar Index spiked to an intraday high just shy of the 107.00 level in Friday's trading on reaction to the better-than-expected NFP report, but broader markets quickly turned risk-on, sending the DXY into a fresh low for the week at 105.95.

The US Dollar is trapped on the low end to close out the trading week after Friday's nearly-1% plunge top-to-bottom, and the DXY is set for a showdown on daily candlesticks with a rising trendline from July's lows at 99.56.

Dollar Index daily chart

Dollar Index technical levels

Dollar Index Spot

Overview
Today last price106.07
Today Daily Change-0.27
Today Daily Change %-0.25
Today daily open106.34
 
Trends
Daily SMA20105.73
Daily SMA50104.25
Daily SMA100103.42
Daily SMA200103.16
 
Levels
Previous Daily High106.85
Previous Daily Low106.32
Previous Weekly High106.84
Previous Weekly Low105.52
Previous Monthly High106.84
Previous Monthly Low103.27
Daily Fibonacci 38.2%106.52
Daily Fibonacci 61.8%106.65
Daily Pivot Point S1106.16
Daily Pivot Point S2105.97
Daily Pivot Point S3105.62
Daily Pivot Point R1106.69
Daily Pivot Point R2107.04
Daily Pivot Point R3107.22

Author

Joshua Gibson

Joshua joins the FXStreet team as an Economics and Finance double major from Vancouver Island University with twelve years' experience as an independent trader focusing on technical analysis.

More from Joshua Gibson
Share:

Editor's Picks

AUD/USD consolidates above 0.7000/two-month low; bearish potential intact

The AUD/USD pair oscillates in a narrow range during the Asian session, and moves little following the release of mixed inflation figures from China. Spot prices currently trade around the 0.7025 region, nearly unchanged for the day, and remain within striking distance of a nearly two-month low set on Tuesday. Renewed hostilities between the US and Iran temper hopes for a deal to end the over three-month-old war.

Japanese Yen languishes despite wholesale inflation accelerates in May

USD/JPY flatlines after experiencing volatility, trading around 160.40 during the Asian hours on Wednesday. The pair continues to hold its ground, reflecting a struggling Japanese Yen that has failed to find support despite a massive acceleration in wholesale inflation. Driven by surging energy costs linked to the ongoing Middle East conflict, Japan’s Producer Price Index jumped 6.3% year-over-year in May. This hot printing comfortably outpaced April’s upwardly revised 5.3% figure and surpassed market consensus of 5.5%, marking the fastest pace of wholesale price growth in three years.

$4,200: Gold retains bearish bias near March low ahead of US CPI

Gold recovers slightly after touching a fresh low since March 23, though it retains a bearish bias near the $4,200 mark through the early European session. Renewed hostilities between the US and Iran fuel inflationary concerns and bolster bets for more hawkish central banks, which is seen as a key factor driving flows away from the non-yielding yellow metal. Furthermore, the decline could be attributed to technical selling following the recent breakdown below the very important 200-day SMA.

Cardano's downtrend deepens despite on-chain bottoming signals

Cardano edges lower to $0.1600 signaling a potential extension of the 30% loss from last week. The altcoin remains under intense selling pressure, weighing on its retail support. Still, a spike in dormant supply re-entering circulation signals that the selling pressure has run its course, a pattern that often precedes a rebound.

US CPI data set to show inflation at three-year high in May, backing Fed hawkish tilt

The US Bureau of Labor Statistics will publish the May Consumer Price Index (CPI) data on Wednesday. The report is expected to show another step up in consumer inflation, driven by the persistently high Oil prices due to the ongoing crisis in the Middle East.

The US economy defies the rules: 100 days into the Oil shock and the recession signal is still missing

More than three months after the start of the Iran war and the resulting disruption to global energy markets, the US economy continues to display remarkable resilience. The conflict has triggered a sharp rise in Oil prices, reignited inflationary pressures and fueled widespread concerns about a potential economic slowdown.