US Dollar Index probes the bottom of the range near 93.50


  • DXY drops further and tests the mmid-93.00s.
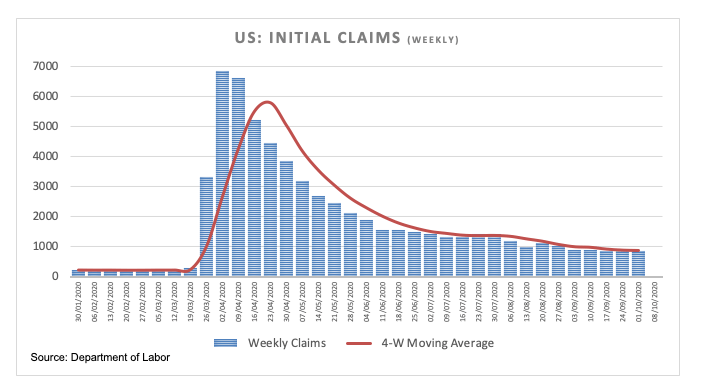
  • US Initial Claims rose by 837K WoW, bettering estimates.
  • All the attention now is on the September’s ISM Manufacturing.

The greenback, measured by the US Dollar Index (DXY), keeps the daily negative performance unchanged around the 93.50 area on Thursday.

US Dollar Index weaker on risk-on mood

The index is adding to the recent leg lower and drops for the fourth session in a row in the second half of the week, this time to fresh multi-day lows in the 93.50 area.

The better sentiment surrounding the risk complex found extra legs in rising hopes that another extra stimulus package in the US could be discussed/delivered sooner rather than later.

While investors wait for the key ISM Manufacturing for the month of September, weekly Claims rose by 837K, less than forecasted. Additional data saw Personal Income contracting 2.7% MoM in August and Personal Spending expanding 1.0% from a moth earlier. Further out, inflation gauged by the Core PCE rose 0.3% inter-month and 1.6% on a year to August.

What to look for around USD

The index started the week on a soft note and extends the leg lower to the sub-94.00 level towards the end of the trading week. It seems the dollar met an important hurdle at the 94.70 region, where coincide a 6-month resistance line. Occasional bullish attempts in DXY are (still) seen as temporary, however, as the underlying sentiment towards the greenback remains cautious-to-bearish. This view is reinforced by the “lower for longer” stance from the Federal Reserve, hopes of a strong recovery in the global economy, the negative position in the speculative community and political uncertainty ahead of the November elections and over further monetary/fiscal stimulus.

US Dollar Index relevant levels

At the moment, the index is retreating 0.23% at 93.58 and faces the next contention at 93.46 (55-day SMA) followed by 92.70 (weekly low Sep.10) and then 91.92 (23.6% Fibo of the 2017-2018 drop). On the other hand, a break above 94.74 (monthly high Sep.25) would open the door to 95.29 (100-day SMA) and finally 96.03 (50% Fibo of the 2017-2018 drop).

Share: Feed news

Information on these pages contains forward-looking statements that involve risks and uncertainties. Markets and instruments profiled on this page are for informational purposes only and should not in any way come across as a recommendation to buy or sell in these assets. You should do your own thorough research before making any investment decisions. FXStreet does not in any way guarantee that this information is free from mistakes, errors, or material misstatements. It also does not guarantee that this information is of a timely nature. Investing in Open Markets involves a great deal of risk, including the loss of all or a portion of your investment, as well as emotional distress. All risks, losses and costs associated with investing, including total loss of principal, are your responsibility. The views and opinions expressed in this article are those of the authors and do not necessarily reflect the official policy or position of FXStreet nor its advertisers. The author will not be held responsible for information that is found at the end of links posted on this page.

If not otherwise explicitly mentioned in the body of the article, at the time of writing, the author has no position in any stock mentioned in this article and no business relationship with any company mentioned. The author has not received compensation for writing this article, other than from FXStreet.

FXStreet and the author do not provide personalized recommendations. The author makes no representations as to the accuracy, completeness, or suitability of this information. FXStreet and the author will not be liable for any errors, omissions or any losses, injuries or damages arising from this information and its display or use. Errors and omissions excepted.

The author and FXStreet are not registered investment advisors and nothing in this article is intended to be investment advice.

Recommended content


Recommended content

Editors’ Picks

EUR/USD regains traction, recovers above 1.0700

EUR/USD regains traction, recovers above 1.0700

EUR/USD regained its traction and turned positive on the day above 1.0700 in the American session. The US Dollar struggles to preserve its strength after the data from the US showed that the economy grew at a softer pace than expected in Q1.

EUR/USD News

GBP/USD returns to 1.2500 area in volatile session

GBP/USD returns to 1.2500 area in volatile session

GBP/USD reversed its direction and recovered to 1.2500 after falling to the 1.2450 area earlier in the day. Although markets remain risk-averse, the US Dollar struggles to find demand following the disappointing GDP data.

GBP/USD News

Gold holds around $2,330 after dismal US data

Gold holds around $2,330 after dismal US data

Gold fell below $2,320 in the early American session as US yields shot higher after the data showed a significant increase in the US GDP price deflator in Q1. With safe-haven flows dominating the markets, however, XAU/USD reversed its direction and rose above $2,340.

Gold News

XRP extends its decline, crypto experts comment on Ripple stablecoin and benefits for XRP Ledger

XRP extends its decline, crypto experts comment on Ripple stablecoin and benefits for XRP Ledger

Ripple extends decline to $0.52 on Thursday, wipes out weekly gains. Crypto expert asks Ripple CTO how the stablecoin will benefit the XRP Ledger and native token XRP. 

Read more

After the US close, it’s the Tokyo CPI

After the US close, it’s the Tokyo CPI

After the US close, it’s the Tokyo CPI, a reliable indicator of the national number and then the BoJ policy announcement. Tokyo CPI ex food and energy in Japan was a rise to 2.90% in March from 2.50%.

Read more

Forex MAJORS

Cryptocurrencies

Signatures