|

US Dollar Index Price Analysis: DXY nearing two-month’s highs, eyeing the 98.20 level

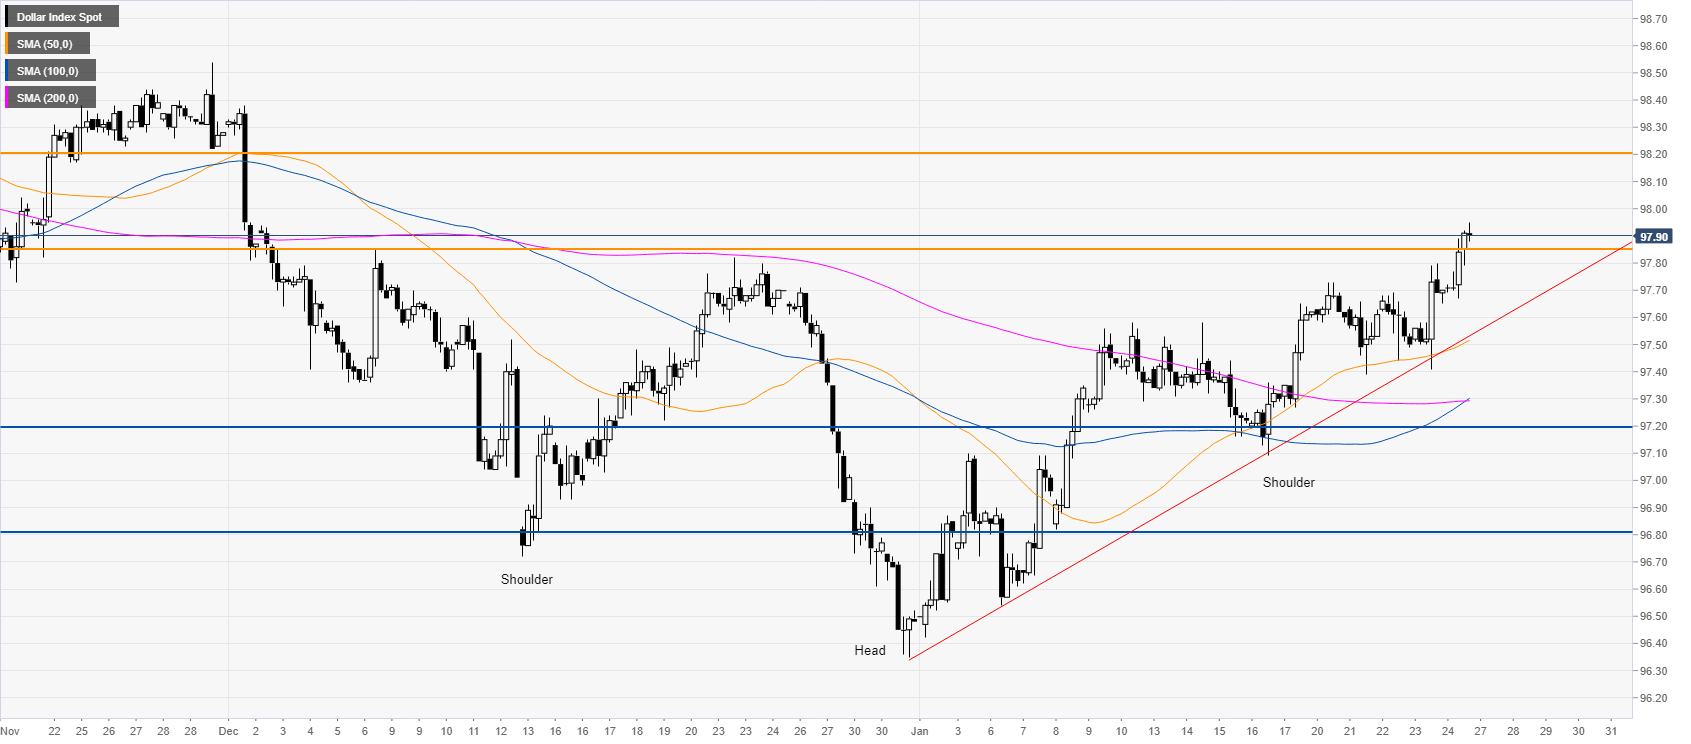
  • The inverse head-and-shoulders pattern is lifting the market.
  • The upside target can be located near the 98.20 level.
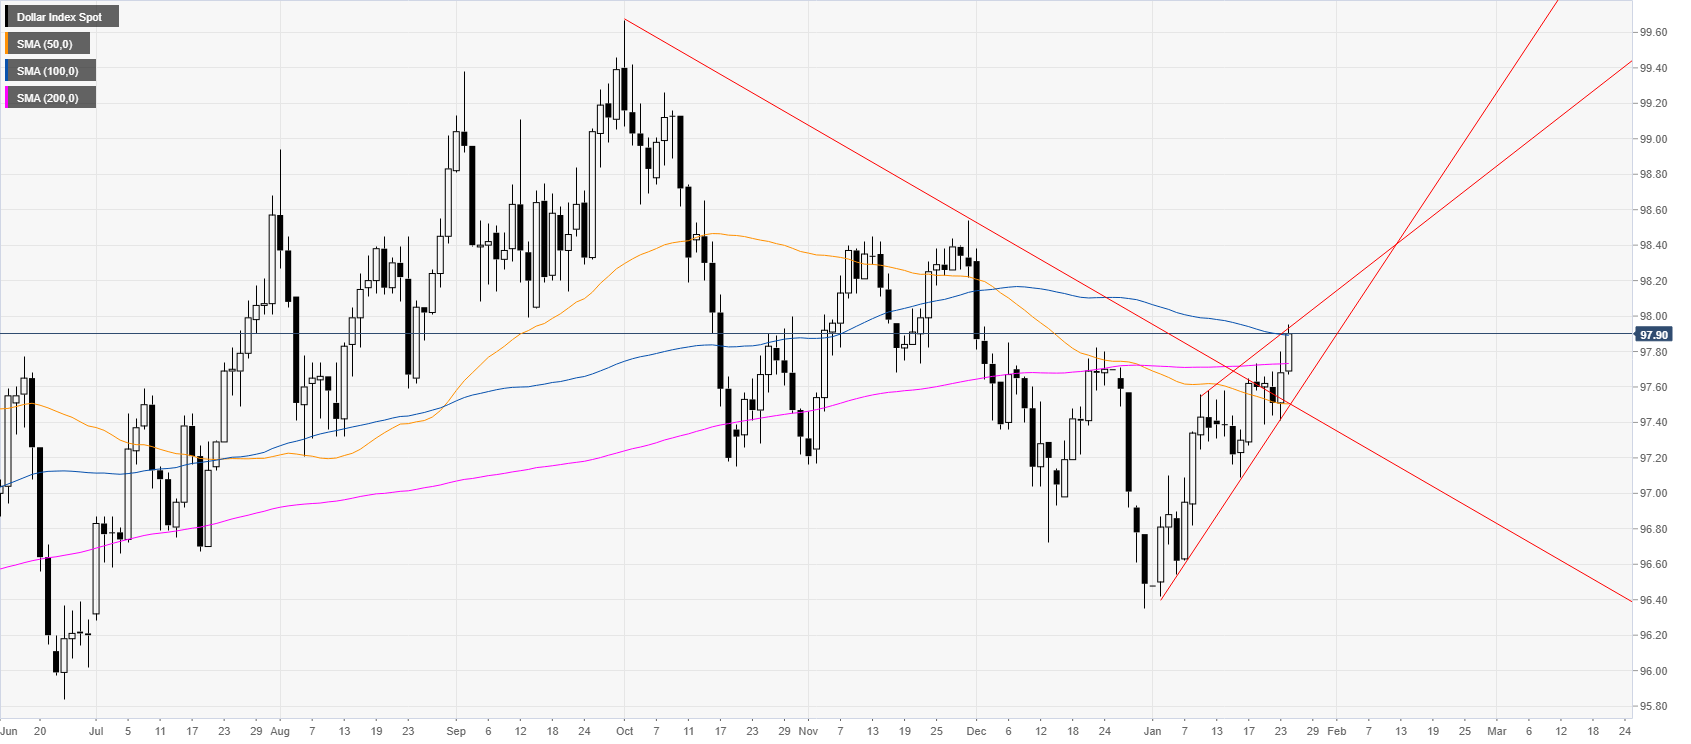
 

DXY daily chart

 
The US dollar index (DXY) is challenging the 100-day simple moving average (SMA) while trading within a bullish channel. 
 

DXY four-hour chart

 
DXY is trading above the main simple moving averages (SMAs) and a bullish trendline, suggesting a constructive bias in the medium term. The greenback is breaking out from an inverted head-and-shoulders formation which is lifting the market above the 97.85 resistance and potentially targetting the 98.20 level on the way up. 
 

Additional key levels

Dollar Index Spot

Overview
Today last price97.9
Today Daily Change0.22
Today Daily Change %0.23
Today daily open97.68
 
Trends
Daily SMA2097.17
Daily SMA5097.51
Daily SMA10097.9
Daily SMA20097.73
 
Levels
Previous Daily High97.8
Previous Daily Low97.41
Previous Weekly High97.65
Previous Weekly Low97.09
Previous Monthly High98.38
Previous Monthly Low96.35
Daily Fibonacci 38.2%97.65
Daily Fibonacci 61.8%97.56
Daily Pivot Point S197.46
Daily Pivot Point S297.24
Daily Pivot Point S397.07
Daily Pivot Point R197.85
Daily Pivot Point R298.02
Daily Pivot Point R398.24

Author

Flavio Tosti

Flavio Tosti

Independent Analyst


More from Flavio Tosti
Share:

Editor's Picks

EUR/USD extends losses toward 1.1600 ahead of EU inflation data

EUR/USD extends the decline toward 1.1600 in the European session on Tuesday. The pair remains under pressure as surging energy prices amid the US-Iran war have increased the risks of higher inflation for the Old Continent. The focus is now on the Eurozone preliminary inflation reading for February. 

GBP/USD drops back toward three-month lows below 1.3350

GBP/USD is back in the red, accelerating its downside toward the three-month lows of 1.3315 in European trading on Tuesday. The ongoing escalation in the Iran war, combined with rising Oil prices, weighs negatively on the higher-yielding Pound Sterling as the US Dollar preserves the previous upside. 

Gold weakens below $5,300 as sustained USD buying counter Middle East tensions

Gold attracts some intraday selling and falls around $100 from the daily top, around the $5,380 area. The US Dollar climbs to a fresh high since January 20 and turns  out to be a key factor exerting downward pressure on the commodity. However, concerns about a broader regional conflict in the Middle East continue to weigh on investors' sentiment and underpin demand for the traditional safe-haven bullion.

Stellar risks deeper losses as derivatives metrics turn negative

Stellar is trading red below $0.16 at the time of writing on Tuesday, after a slight recovery the previous day. Weakening derivatives data caps the recovery, while an unfavorable technical outlook projects a deeper correction for the XLM token in the upcoming days.

The market is not panicking it is repricing the probability distribution of Oil and time

At the end of the day, markets do not trade morality or geopolitics. They trade transmission channels. And the only channel that truly matters in this maelstrom runs through the price of energy and the time value of money.

Hyperliquid Price Forecast: HYPE rises on commodities demand amid US-Iran war

Hyperliquid (HYPE) steadies above $33 at press time on Tuesday, marking its fourth consecutive day of recovery in a broadly volatile market due to the ongoing US-Israel strikes on Iran.