|

US Dollar Index Price Analysis: DXY bulls nearing the 97.85 resistance

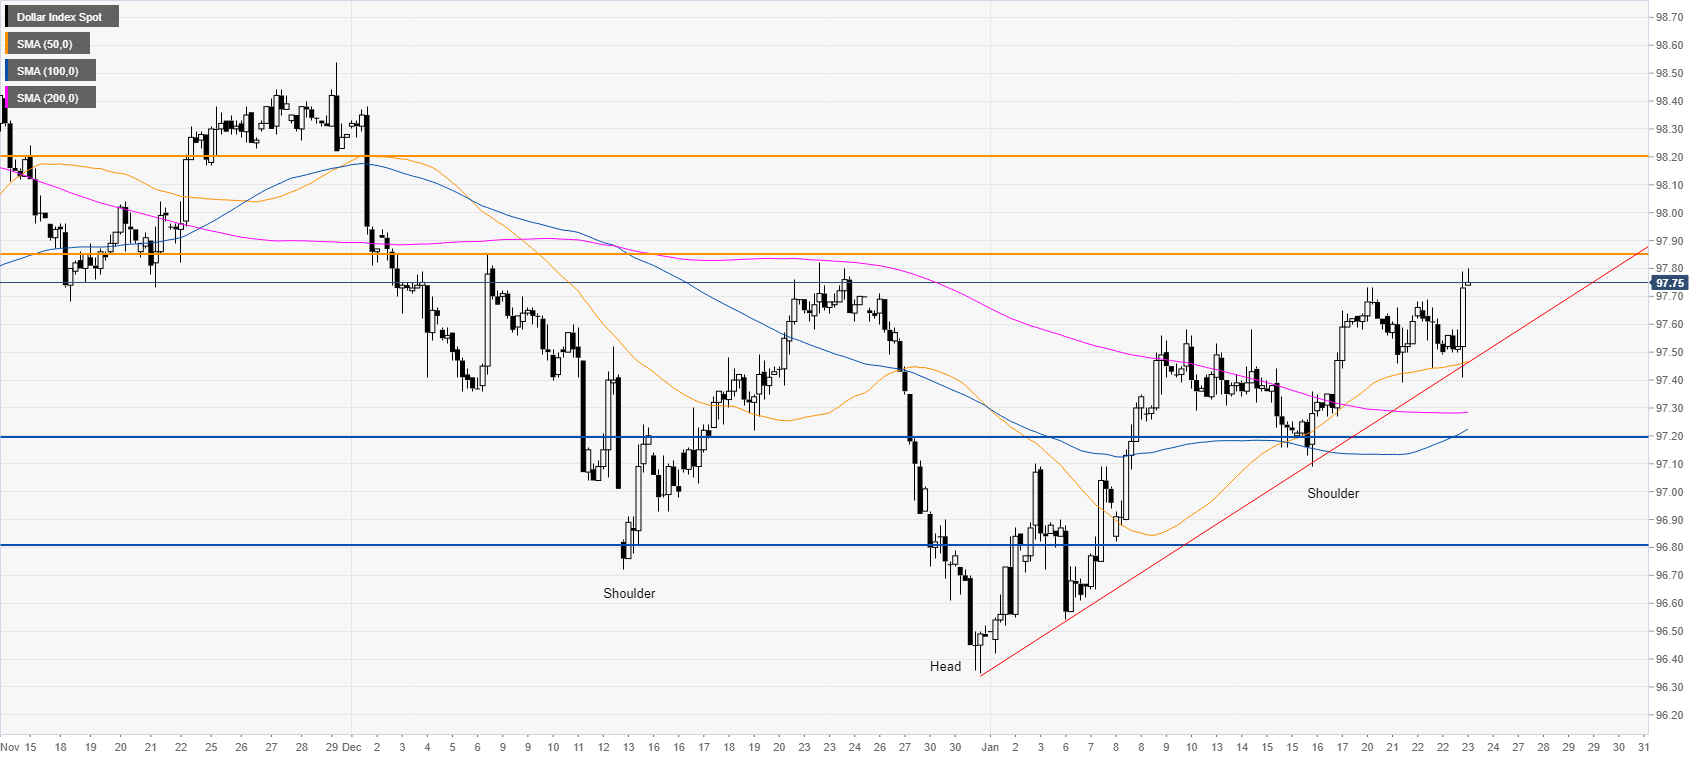
  • The inverse head-and-shoulders pattern is keeping the bullish bias intact.
  • Upside targets can be located near 97.85 and 98.20 levels.
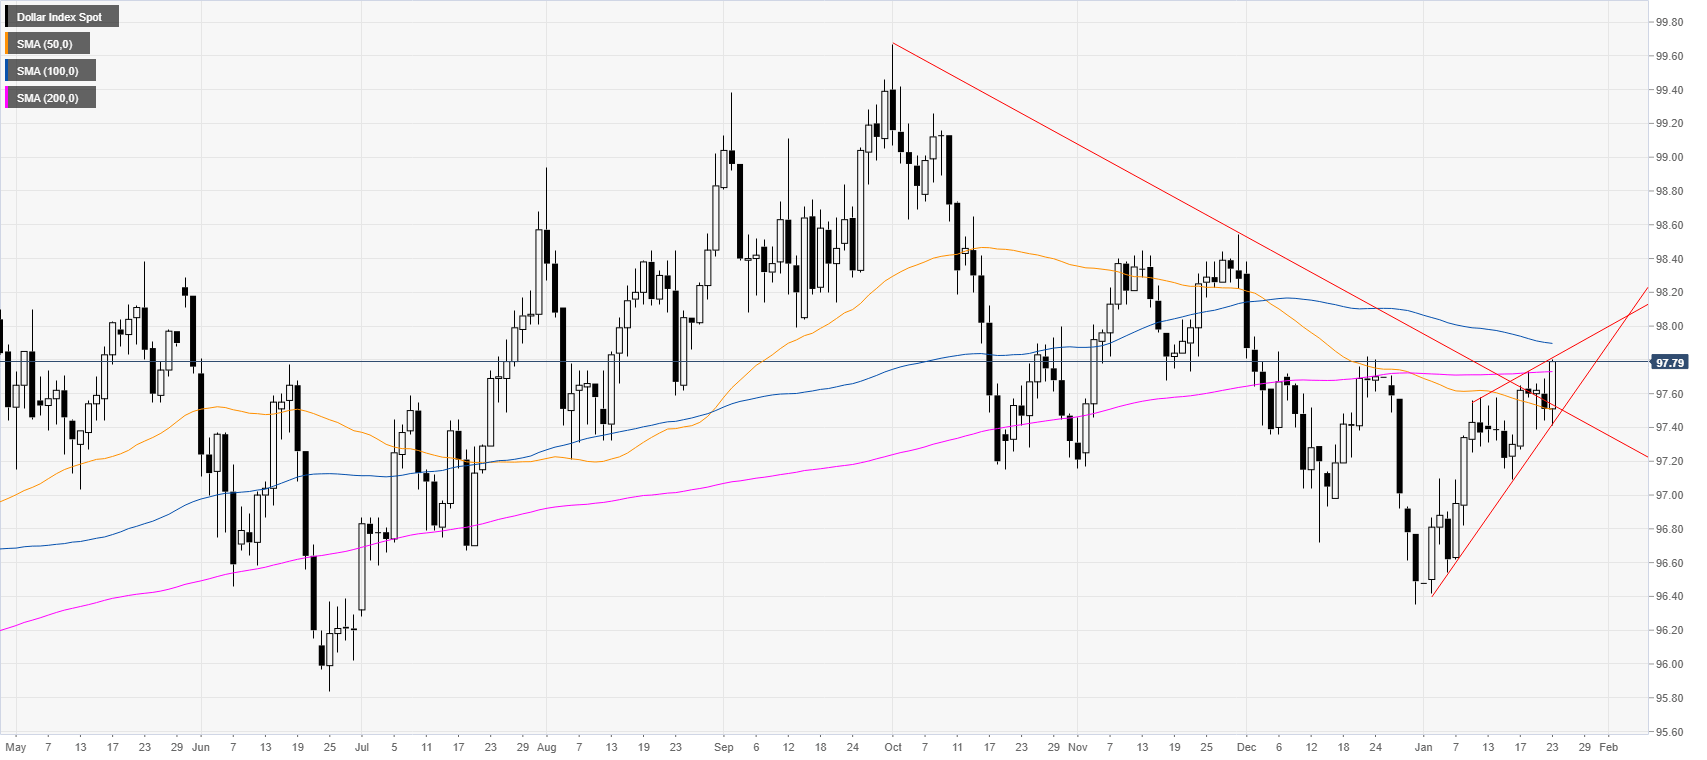
 

DXY daily chart

 
The US dollar index (DXY) is challenging the 200-day simple moving average (SMA) while trading within a rising wedge channel. The ECB press conference weighed on the euro and lifted the US dollar index. 
 

DXY four-hour chart

 
DXY is trading above the main simple moving averages (SMAs) and a bullish trendline, suggesting a constructive bias in the medium term. The greenback is equally in an inverted head-and-shoulders pattern which is lifting the market towards the 97.85 and 98.20 levels on the way up. 
 

Additional key levels

Dollar Index Spot

Overview
Today last price97.76
Today Daily Change0.25
Today Daily Change %0.26
Today daily open97.51
 
Trends
Daily SMA2097.17
Daily SMA5097.52
Daily SMA10097.9
Daily SMA20097.73
 
Levels
Previous Daily High97.69
Previous Daily Low97.44
Previous Weekly High97.65
Previous Weekly Low97.09
Previous Monthly High98.38
Previous Monthly Low96.35
Daily Fibonacci 38.2%97.54
Daily Fibonacci 61.8%97.59
Daily Pivot Point S197.4
Daily Pivot Point S297.3
Daily Pivot Point S397.15
Daily Pivot Point R197.65
Daily Pivot Point R297.8
Daily Pivot Point R397.9

Author

Flavio Tosti

Flavio Tosti

Independent Analyst


More from Flavio Tosti
Share:

Editor's Picks

EUR/USD: Breakdown below trading range support near 1.1770 comes into play

The EUR/USD pair opens with a bearish gap at the start of a new week as the US-Iran war-led global flight to safety boosts the US Dollar. Spot prices, however, lack follow-through selling and manage to hold above mid-1.1700s during the Asian session.

GBP/USD declines below 1.3450 on Middle East tensions, UK political uncertainty

The GBP/USD pair attracts some sellers to around 1.3420 during the early Asian session on Monday. The US Dollar edges higher against the Cable amid escalating tensions in the Middle East after recent US-Israeli strikes on Iran over the weekend.

Gold jumps over 2% toward $5,400 after US, Israel attack Iran

Gold is on fire at the start of the week, a widely expected move, as investors seek harbor in the traditional store of value, following the continued US and Israel attacks on Iran. The bright metal opened with a bullish gap of about $17 and rallied toward the $5,400 level as Asian traders hit their desks and reacted negatively to the weekend news of the Middle East conflict, rushing for cover in Gold.

Iran escalation: Quick thoughts on markets

Markets are likely to open the week with risk-off, with declines led by airlines, cyclicals and trade-exposed names, while energy, defense and “strategic” sectors may be relatively steadier.

Crisis in the Middle East: The market reaction

A primer on how markets will open on Monday, and why geopolitical risk may not be easily absorbed by financial markets this time around. Geopolitics and events between Iran, the US and the wider Middle East will dominate financial markets on Monday. The situation has continued to escalate as we move through Sunday. 

Starknet unveils strkBTC, shielded Bitcoin transactions on Ethereum Layer 2

Starknet, the Ethereum Layer 2 network developed by StarkWare, today announced strkBTC, a wrapped Bitcoin asset that introduces optional shielding while preserving full DeFi composability.