US Dollar Index Price Analysis: 21-day SMA guards recovery moves
- DXY fades recovery moves from three-day low as buyers flirt with intraday top.
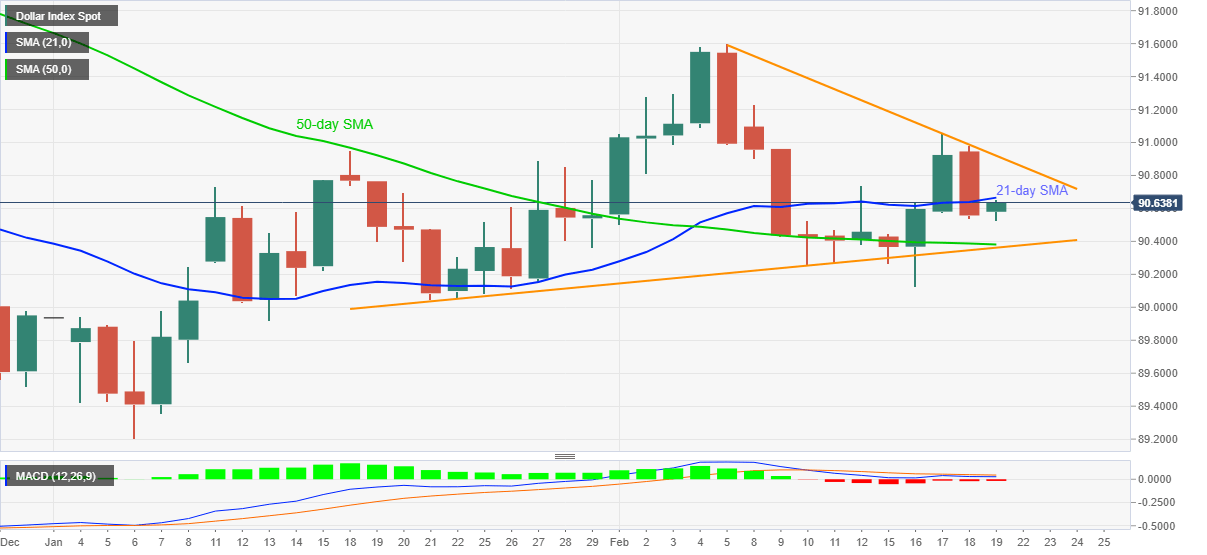
- Bearish MACD probes further upside, 50-day SMA, one-month-old support line offer strong support.

US dollar index (DXY) takes rounds to the day’s top of 90.65, up 0.09% on a day, during early Friday. In doing so, the greenback gauge consolidates the previous day’s losses, the biggest in over a week while trying to stay above a confluence of 50-day SMA and an ascending trend line from January 21.
Even so, bearish MACD signals and 21-day SMA near 90.66 test the corrective pullback targeting a two-week-old falling trend line, at 90.92 now.
Should the quote manage to cross the stated trend line hurdle, the weekly top of 91.05 needs to break if the monthly top surrounding 91.60 require fresh attention.
Meanwhile, pullbacks from the current levels may again eye the key support joint around 90.38, including 50-day SMA and aforementioned rising trend line from late January.
If the DXY closes below 90.38 on a daily chart, the 90.00 threshold will become the favorite of the greenback bears.
DXY daily chart
Trend: Sideways
Author

Anil Panchal
FXStreet
Anil Panchal has nearly 15 years of experience in tracking financial markets. With a keen interest in macroeconomics, Anil aptly tracks global news/updates and stays well-informed about the global financial moves and their implications.


