US Dollar Index (DXY) Price Forecast: Hovering at the key 99.00 level
- The USD Index struggles to regain the 99.00 level ahead of the US PCE Price Index release.
- The Index remains under pressure after having depreciated about 1.5% over the last two weeks.
- Failure to regain 99.00 would confirm a double top pattern at 100.35.
The US Dollar remains practically flat at the key 99.00 level on Friday after having picked up from fresh one-month lows at 98.80 on Thursday. The pair is attempting to regain lost ground after having depreciated nearly 1.5% last week, but investors are wary of placing large US Dollar longs ahead of next week’s Federal Reserve (Fed) Monetary Policy Meeting.
Later on Friday, the US Personal Consumption Expenditures is expected to confirm that price pressures remain elevated. These figures, however, are unlikely to change the view that the Fed will be forced to cut interest rates further next week to dynamize a stalled labour market. The main interest of the event, however, will be on assessing what comes after
Technical Analysis: The DXY is at the neckline of a Double Top pattern
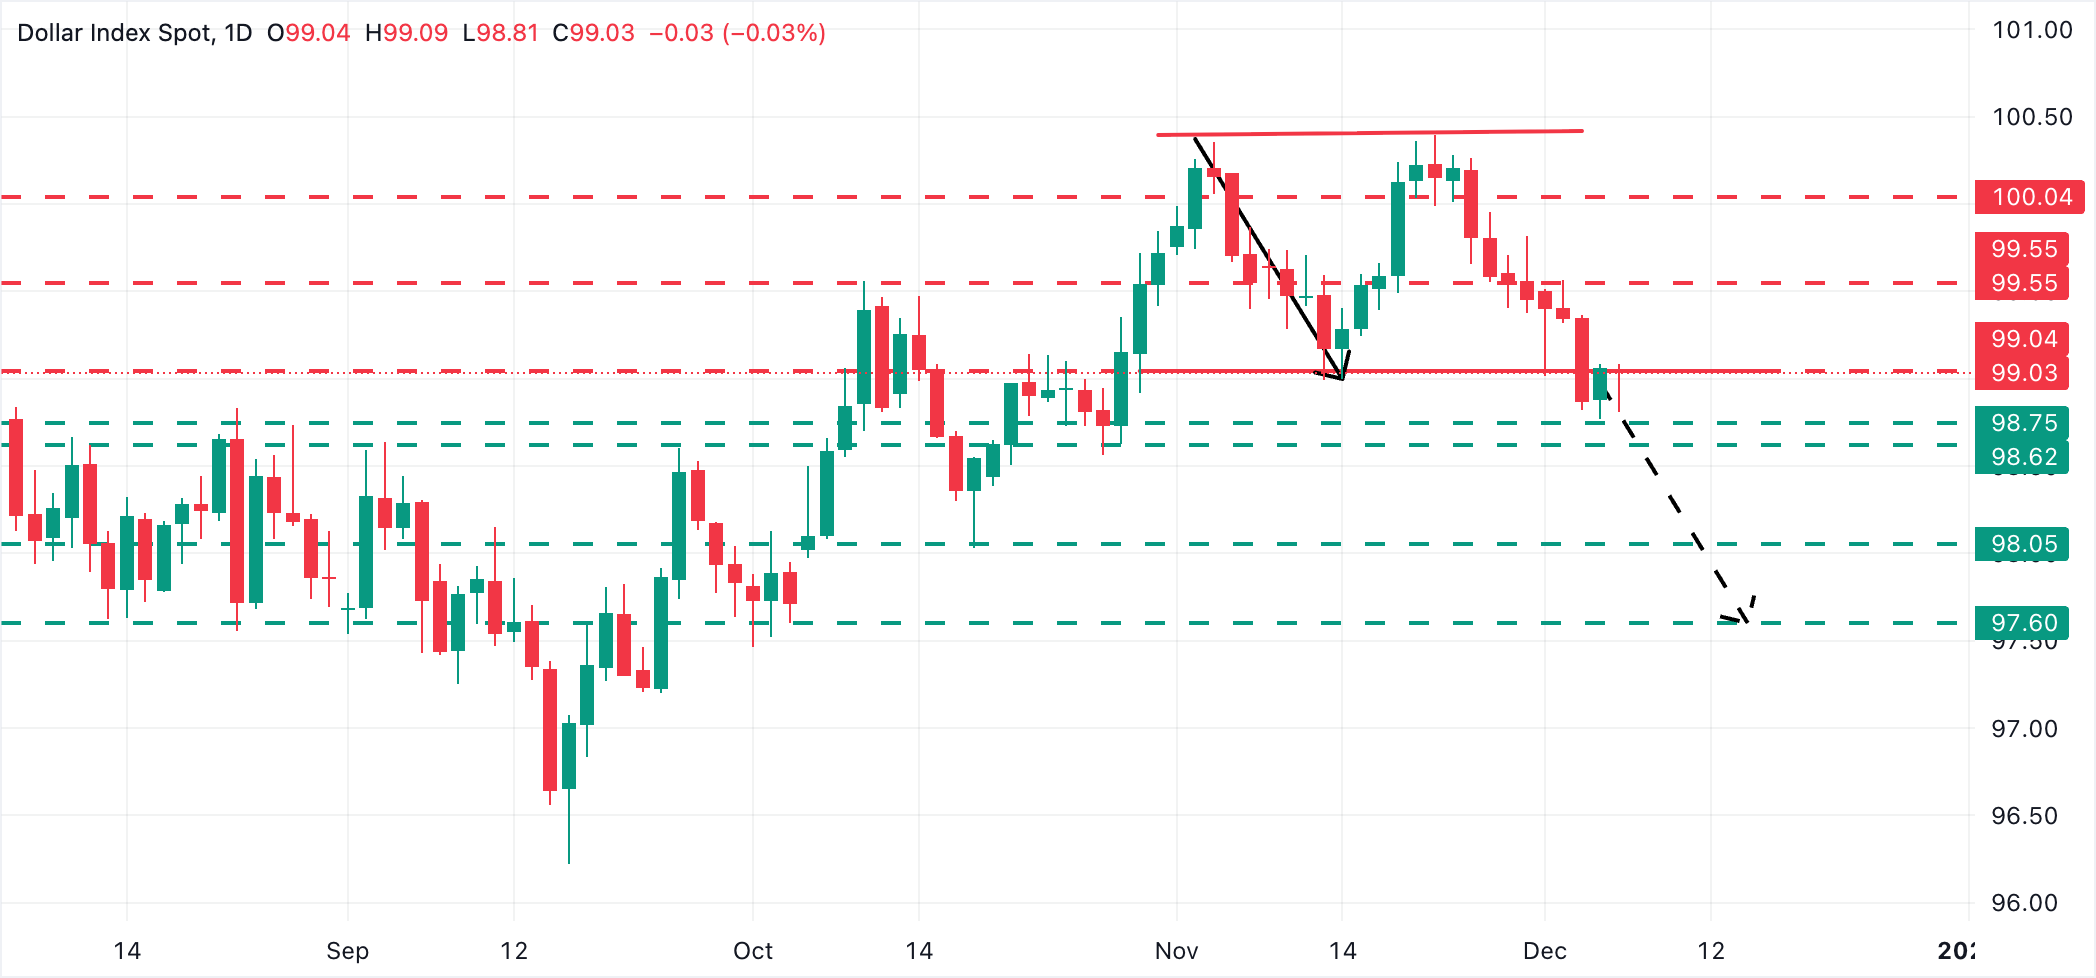
The US Dollar Index daily chart shows price action capped below a Double Top Pattern's neckline at 99.00. This is usually a figure that signals trend shifts, and it might be anticipating a deeper correction of the September-November rally.
Failure to return above the 99.00 area would increase pressure towards the support levels in the area between 98.80 and 98.60 (December 4 and October 29 lows, respectively. Further down, the October 17 low, in the 98.00 area, will come into play. The Double Top's measured target is at the October 3 low of 97.60.
On the upside, a confirmation above the 99.00 level would clear the path towards the December 2 high near 99.55 and the 100.00 psychological level, a support on November 21 and 24, which now would likely close the path towards November’s peaks in the area of 100.35.
US Dollar Price This week
The table below shows the percentage change of US Dollar (USD) against listed major currencies this week. US Dollar was the strongest against the Swiss Franc.
| USD | EUR | GBP | JPY | CAD | AUD | NZD | CHF | |
|---|---|---|---|---|---|---|---|---|
| USD | -0.45% | -0.74% | -0.67% | -0.22% | -1.30% | -0.74% | -0.07% | |
| EUR | 0.45% | -0.30% | -0.22% | 0.23% | -0.86% | -0.29% | 0.38% | |
| GBP | 0.74% | 0.30% | 0.33% | 0.53% | -0.59% | 0.02% | 0.68% | |
| JPY | 0.67% | 0.22% | -0.33% | 0.44% | -0.67% | -0.09% | 0.58% | |
| CAD | 0.22% | -0.23% | -0.53% | -0.44% | -1.14% | -0.51% | 0.16% | |
| AUD | 1.30% | 0.86% | 0.59% | 0.67% | 1.14% | 0.58% | 1.25% | |
| NZD | 0.74% | 0.29% | -0.02% | 0.09% | 0.51% | -0.58% | 0.67% | |
| CHF | 0.07% | -0.38% | -0.68% | -0.58% | -0.16% | -1.25% | -0.67% |
The heat map shows percentage changes of major currencies against each other. The base currency is picked from the left column, while the quote currency is picked from the top row. For example, if you pick the US Dollar from the left column and move along the horizontal line to the Japanese Yen, the percentage change displayed in the box will represent USD (base)/JPY (quote).
Author

Guillermo Alcala
FXStreet
Graduated in Communication Sciences at the Universidad del Pais Vasco and Universiteit van Amsterdam, Guillermo has been working as financial news editor and copywriter in diverse Forex-related firms, like FXStreet and Kantox.