|

US Dollar Index Asia Price Forecast: DXY trades in two-day lows below 100.00 handle

  • US dollar index (DXY) is easing down just below the 100.00 mark. 
  • Support can emerge near the 99.50 and 99.00 levels. 
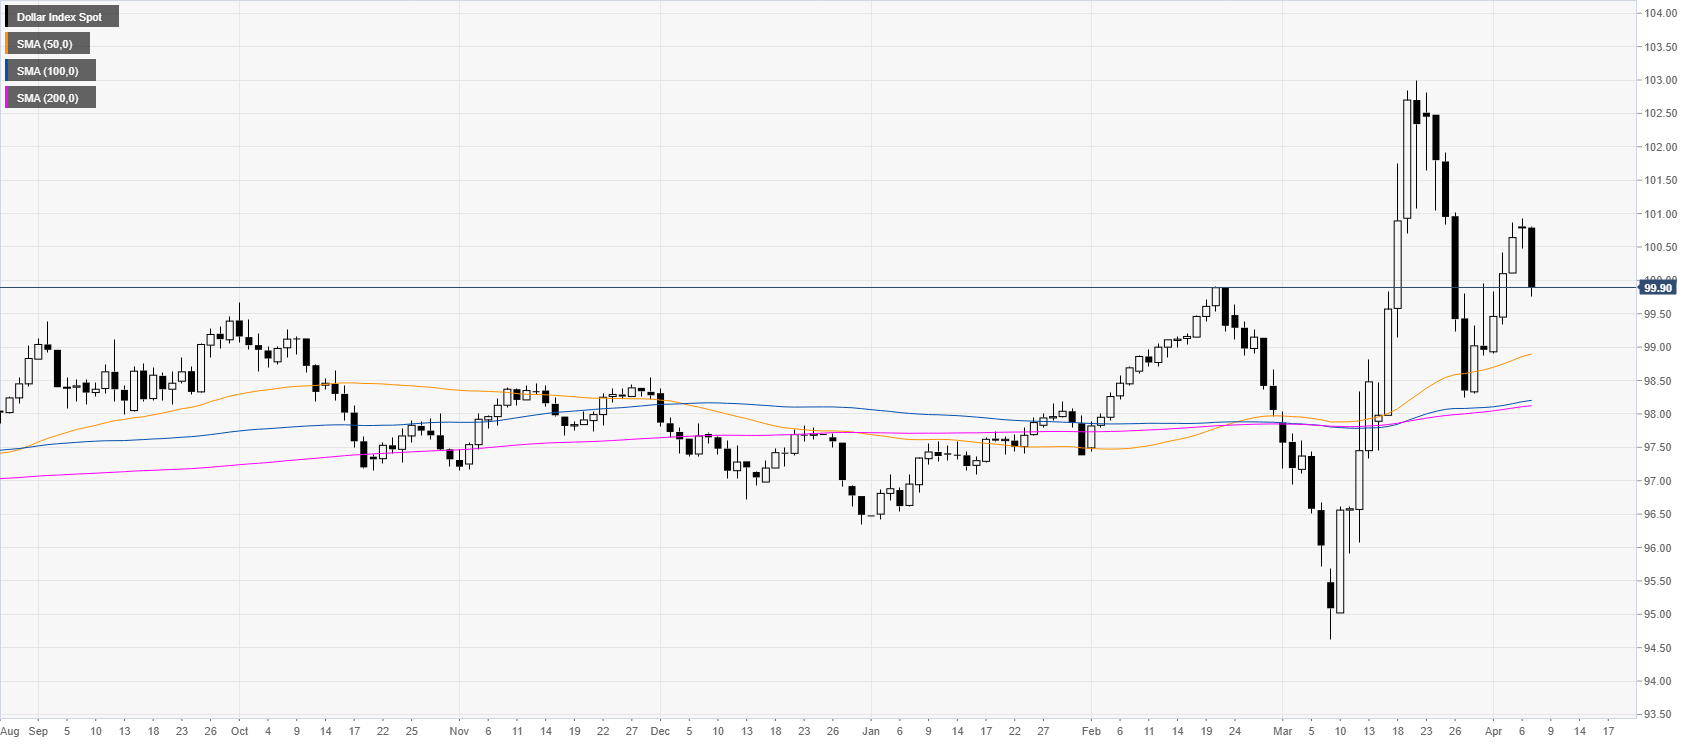
DXY daily chart

DXY is trading in an uptrend above the main daily SMAs, although the greenback is trading in two-day lows below the 100.00 psychological mark.
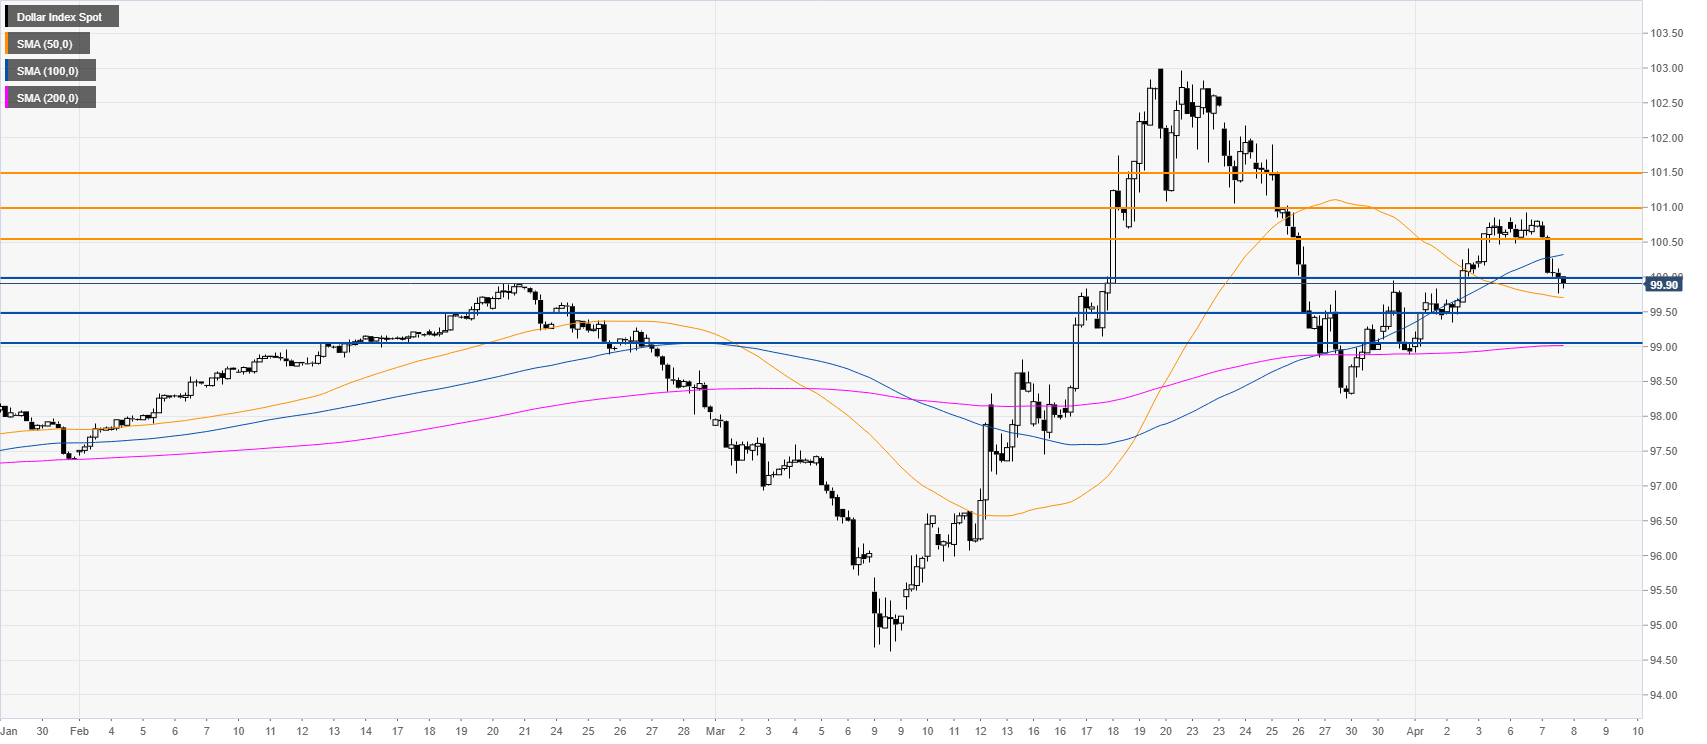
  

DXY four-hour chart

DXY is trading above its 50/200 SMAs on the four-hour chart suggesting a bullish bias in the medium term. However, bulls need to regain the 101.00 figure in order to resume the uptrend towards the 101.50 level. On the flip side, the market could find support near the 99.50 and 99.00 price levels on the way down. 


Additional key levels

Dollar Index Spot

Overview
Today last price99.9
Today Daily Change-0.90
Today Daily Change %-0.89
Today daily open100.8
 
Trends
Daily SMA2099.72
Daily SMA5098.86
Daily SMA10098.18
Daily SMA20098.11
 
Levels
Previous Daily High100.93
Previous Daily Low100.48
Previous Weekly High100.86
Previous Weekly Low98.31
Previous Monthly High103
Previous Monthly Low94.63
Daily Fibonacci 38.2%100.76
Daily Fibonacci 61.8%100.65
Daily Pivot Point S1100.54
Daily Pivot Point S2100.29
Daily Pivot Point S3100.09
Daily Pivot Point R1100.99
Daily Pivot Point R2101.19
Daily Pivot Point R3101.44

Author

Flavio Tosti

Flavio Tosti

Independent Analyst


More from Flavio Tosti
Share:

Editor's Picks

EUR/USD seems fragile below 1.1700 as Middle East war boosts energy prices

The EUR/USD pair trades flat at around 1.1680 during the Asian trading session on Tuesday, but broadly seems vulnerable, being close to its five-week low. The major currency pair is under pressure as surging oil prices due to the United States-Israel war with Iran have increased the risks of higher inflation for the Old Continent.

GBP/USD hovers around 1.3400 with bearish pressure intact

GBP/USD edges higher after three days of losses, trading around 1.3400 during the Asian hours on Tuesday. The technical analysis of the daily chart indicates an ongoing bearish bias, as the pair trades within a descending channel pattern.

Gold sticks to gains above $5,350 amid sustained safe-haven demand; firmer USD caps gains

Gold sticks to its positive bias for the third straight day and trades above the $5,350 level heading into the European session on Tuesday. Concerns about a broader regional conflict in the Middle East continue to weigh on investors' sentiment and underpin demand for the traditional safe-haven bullion.

Stellar risks deeper losses as derivatives metrics turn negative

Stellar is trading red below $0.16 at the time of writing on Tuesday, after a slight recovery the previous day. Weakening derivatives data caps the recovery, while an unfavorable technical outlook projects a deeper correction for the XLM token in the upcoming days.

The market is not panicking it is repricing the probability distribution of Oil and time

At the end of the day, markets do not trade morality or geopolitics. They trade transmission channels. And the only channel that truly matters in this maelstrom runs through the price of energy and the time value of money.

Hyperliquid Price Forecast: HYPE rises on commodities demand amid US-Iran war

Hyperliquid (HYPE) steadies above $33 at press time on Tuesday, marking its fourth consecutive day of recovery in a broadly volatile market due to the ongoing US-Israel strikes on Iran.