US Crude Oil Price Forecast: WTI rises as focus shifts to upcoming API report
- West Texas Intermediate (WTI) edges higher, approaching the $65.00 mark.
- WTI Crude Oil gains are restricted by the 100-day moving average, providing additional resistance at $65.31.
- US Crude Oil inventory data could serve as an additional catalyst for WTI with the weekly API report due at 20.30 GMT.

West Texas Intermediate (WTI) Crude Oil is staging a mild rebound on Tuesday, as traders continue to monitor supply and demand dynamics.
WTI Crude Oil is trading near $65.00, with intraday gains nearing 1% at the time of writing.
As the US Oil benchmark continues to trade within a well-defined range between $64.00 and $65.00, focus turns to the upcoming American Petroleum Institute (API) report.
The API will release its weekly Statistical Bulletin (WBS), providing insight into US crude oil stockpiles. According to FXStreet data, Tuesday’s report is expected to show Oil stockpiles declining by 2.26 M barrels, after a 4.277 M barrel drawdown last week.
Will US Oil inventory data drive WTI out of its current range?
Over the past five weeks, the report has revealed that Crude Oil stockpiles have continued to decline, reflecting rising demand. However, the Israel-Iran conflict, which ignited fears over potential disruptions to the Strait of Hormuz, had been a major contributor to depleting stockpiles.
With easing tensions in the Middle East, the Organization of the Petroleum Exporting Countries and its allies (OPEC+) continue to increase supply, limiting the upside move.
However, even with OPEC+ gradually adding supply, sentiment appears to be stabilizing after last week’s steep 12% slide.
If Tuesday’s data points to a deeper-than-forecast draw, it could signal stronger domestic consumption and offer short-term support as the third quarter begins.
Crude Oil technical analysis: WTI rises toward $65.00
With WTI currently testing the $65.00 psychological level, the 100-day Simple Moving Average (SMA) is providing resistance near $65.31. A move above this level could see the price retest the next round number of $66.00, opening the door for the 50% Fibonacci level of the January-April decline at $67.00.
The Relative Strength Index (RSI) is pointing higher, but remains slightly bearish near 47.
WTI (US Crude) Oil daily chart
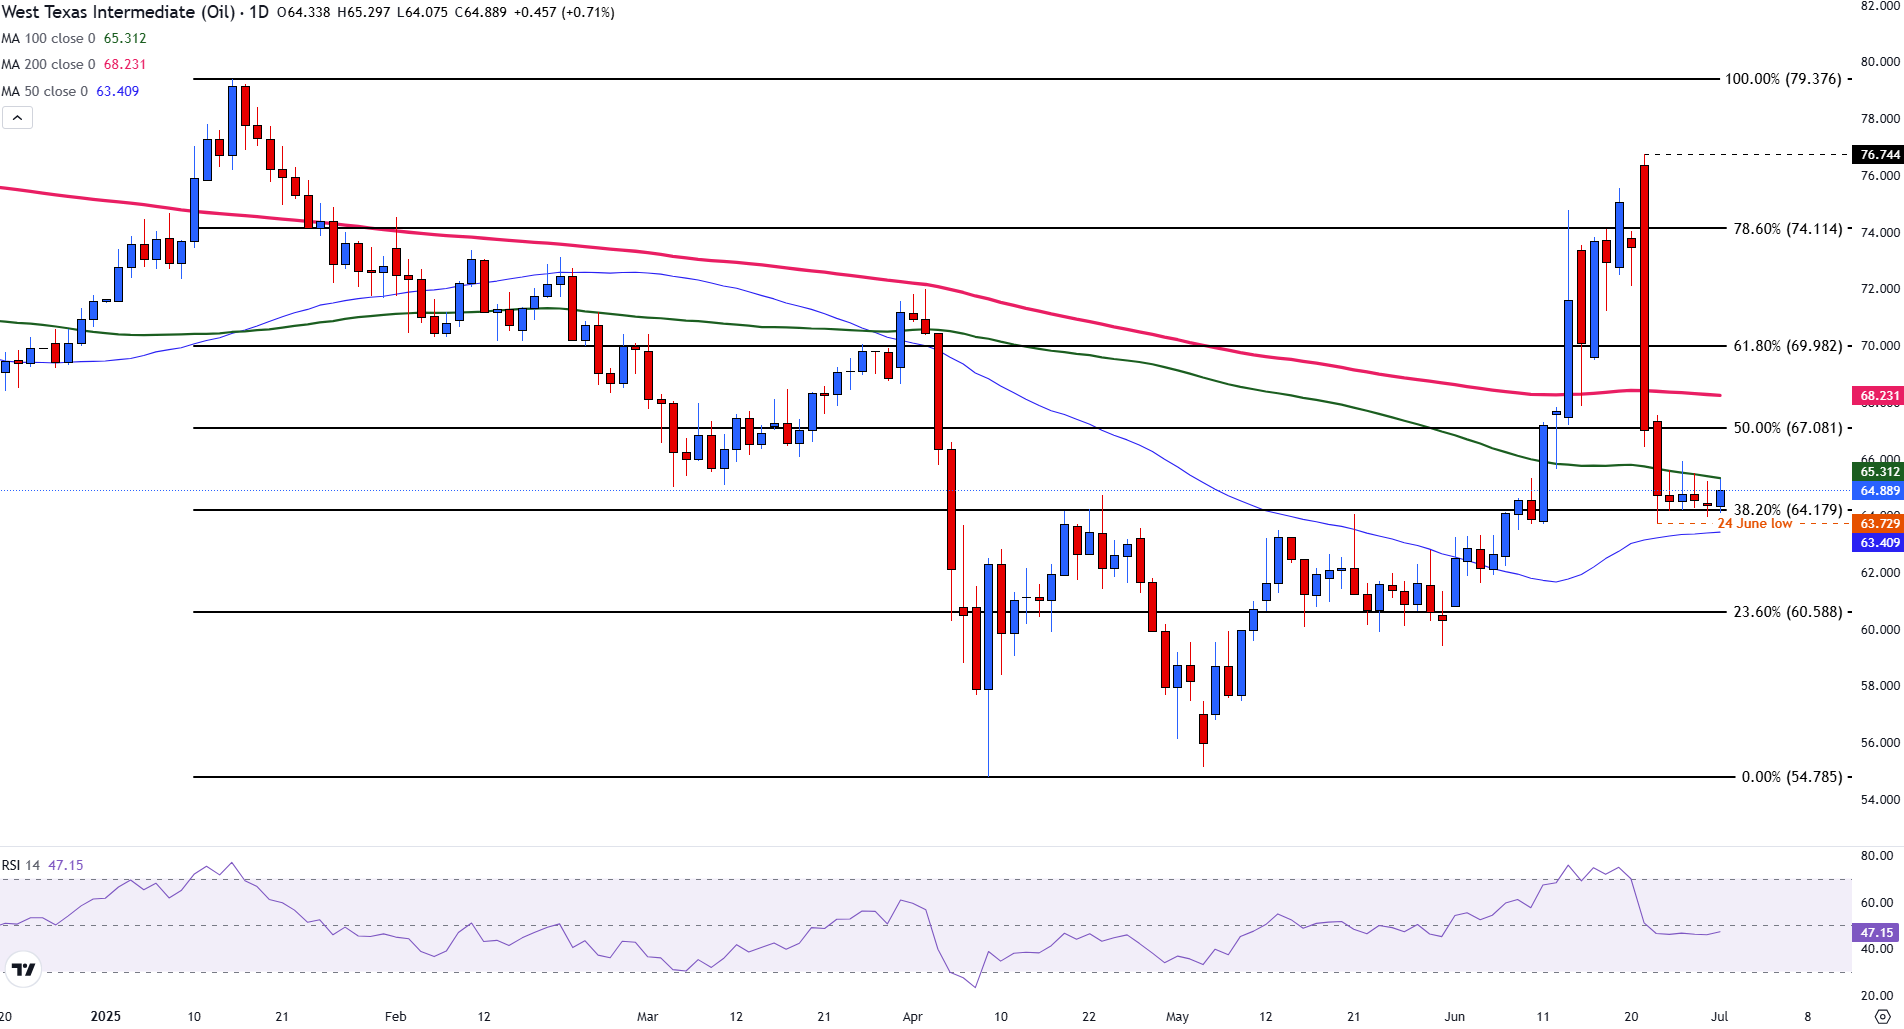
If prices fail to hold above $65.00, prices could fall to the 38.2% Fibo level, providing support at $64.18. The June low at $63.73 lies below, a break of which brings the 50-day SMA into play at $63.41.
Economic Indicator
API Weekly Crude Oil Stock
API’s Weekly Statistical Bulletin (WSB) has reported total U.S. and regional data relating to refinery operations and the production of the four major petroleum products: motor gasoline, kerosene jet fuel, distillate (by sulfur content), and residual fuel oil. These products represent more than 85% of total petroleum industry.
Read more.Next release: Tue Jul 01, 2025 20:30
Frequency: Weekly
Consensus: -2.26M
Previous: -4.277M
Source: American Petroleum Institute
WTI Oil FAQs
WTI Oil is a type of Crude Oil sold on international markets. The WTI stands for West Texas Intermediate, one of three major types including Brent and Dubai Crude. WTI is also referred to as “light” and “sweet” because of its relatively low gravity and sulfur content respectively. It is considered a high quality Oil that is easily refined. It is sourced in the United States and distributed via the Cushing hub, which is considered “The Pipeline Crossroads of the World”. It is a benchmark for the Oil market and WTI price is frequently quoted in the media.
Like all assets, supply and demand are the key drivers of WTI Oil price. As such, global growth can be a driver of increased demand and vice versa for weak global growth. Political instability, wars, and sanctions can disrupt supply and impact prices. The decisions of OPEC, a group of major Oil-producing countries, is another key driver of price. The value of the US Dollar influences the price of WTI Crude Oil, since Oil is predominantly traded in US Dollars, thus a weaker US Dollar can make Oil more affordable and vice versa.
The weekly Oil inventory reports published by the American Petroleum Institute (API) and the Energy Information Agency (EIA) impact the price of WTI Oil. Changes in inventories reflect fluctuating supply and demand. If the data shows a drop in inventories it can indicate increased demand, pushing up Oil price. Higher inventories can reflect increased supply, pushing down prices. API’s report is published every Tuesday and EIA’s the day after. Their results are usually similar, falling within 1% of each other 75% of the time. The EIA data is considered more reliable, since it is a government agency.
OPEC (Organization of the Petroleum Exporting Countries) is a group of 12 Oil-producing nations who collectively decide production quotas for member countries at twice-yearly meetings. Their decisions often impact WTI Oil prices. When OPEC decides to lower quotas, it can tighten supply, pushing up Oil prices. When OPEC increases production, it has the opposite effect. OPEC+ refers to an expanded group that includes ten extra non-OPEC members, the most notable of which is Russia.
Author

Tammy Da Costa, CFTe®
FXStreet
Tammy is an economist and market analyst with a deep passion for financial markets, particularly commodities and geopolitics.


