Breaking: US CPI inflation rises to 3.8% in April vs. 3.7% expected

Annual inflation in the United States (US), as measured by the change in the Consumer Price Index (CPI), climbed to 3.8% in April from 3.3% in March, the US Bureau of Labor Statistics (BLS) reported on Tuesday. This print surpassed the market expectation of 3.7%. On a monthly basis, the CPI rose 0.6%, following the March's increase of 0.9% and matching analysts' estimate.
The core CPI, which excludes volatile food and energy prices, rose 0.4% and 2.8% on a monthly and yearly basis, respectively.
"The index for energy rose 3.8 percent in April, accounting for over forty percent of the monthly all items increase," the BLS noted in its press release. "The shelter index also increased in April, rising 0.6 percent. The index for food increased 0.5 percent over the month as the index for food at home rose 0.7 percent and the index for food away from home increased 0.2 percent."

Market reaction to US CPI inflation data
The US Dollar (USD) Index edged slightly higher with the immediate reaction and was last seen rising 0.4% on the day at 98.30.
US Dollar Price Today
The table below shows the percentage change of US Dollar (USD) against listed major currencies today. US Dollar was the strongest against the British Pound.
| USD | EUR | GBP | JPY | CAD | AUD | NZD | CHF | |
|---|---|---|---|---|---|---|---|---|
| USD | 0.33% | 0.61% | 0.22% | 0.20% | 0.34% | 0.21% | 0.39% | |
| EUR | -0.33% | 0.26% | -0.11% | -0.17% | -0.01% | -0.14% | 0.06% | |
| GBP | -0.61% | -0.26% | -0.40% | -0.44% | -0.28% | -0.40% | -0.21% | |
| JPY | -0.22% | 0.11% | 0.40% | -0.05% | 0.10% | -0.01% | 0.15% | |
| CAD | -0.20% | 0.17% | 0.44% | 0.05% | 0.14% | 0.02% | 0.19% | |
| AUD | -0.34% | 0.00% | 0.28% | -0.10% | -0.14% | -0.12% | 0.05% | |
| NZD | -0.21% | 0.14% | 0.40% | 0.01% | -0.02% | 0.12% | 0.16% | |
| CHF | -0.39% | -0.06% | 0.21% | -0.15% | -0.19% | -0.05% | -0.16% |
The heat map shows percentage changes of major currencies against each other. The base currency is picked from the left column, while the quote currency is picked from the top row. For example, if you pick the US Dollar from the left column and move along the horizontal line to the Japanese Yen, the percentage change displayed in the box will represent USD (base)/JPY (quote).
This section below was published as a preview of the US Consumer Price Index (CPI) data at 04:00 GMT.
- The US Consumer Price Index is expected to rise 3.7% YoY in April as energy prices remain persistently high.
- Annual core CPI inflation is expected to edge slightly higher to 2.7%.
- EUR/USD’s technical outlook highlights a bullish stance that lacks momentum.
The US Bureau of Labor Statistics (BLS) will publish the April Consumer Price Index (CPI) data on Tuesday.
The report is expected to show another significant leap in consumer inflation after March’s sharp increase, driven by the elevated Oil prices due to the ongoing conflict between the United States (US) and Iran.
The monthly CPI is forecast to rise 0.6%, following the 0.9% increase recorded in March, while the annual reading is seen climbing to its highest level since September 2023 at 3.7%, from 3.3% in March. Core CPI figures, which exclude volatile food and energy prices, are expected to come in at 0.3% and 2.7%, on a monthly and yearly basis, respectively.
From the beginning of the conflict in the Middle East on February 28 to the end of April, the barrel of West Texas Intermediate (WTI) rose more than 50%. Although crude Oil prices corrected lower in the first week of May, they are still about 40% above where they were before the US-Iran war.
Previewing the inflation data, "our economists expect headline inflation to rise by +0.58% month-on-month, moderating from March’s +0.9%, but still relatively firm,” said Deutsche Bank’s Jim Reid.
"In contrast, the core measure is projected to accelerate to +0.39% MoM from +0.2%, suggesting underlying price pressures remain sticky even as energy-related effects fade. The YoY rates would move from 3.3% to 3.8% for the former and from 2.6% to 2.8% for the latter,” Reid added.
Economic Indicator
Consumer Price Index (MoM)
Inflationary or deflationary tendencies are measured by periodically summing the prices of a basket of representative goods and services and presenting the data as The Consumer Price Index (CPI). CPI data is compiled on a monthly basis and released by the US Department of Labor Statistics. The MoM figure compares the prices of goods in the reference month to the previous month.The CPI is a key indicator to measure inflation and changes in purchasing trends. Generally, a high reading is seen as bullish for the US Dollar (USD), while a low reading is seen as bearish.
Read more.Next release: Tue May 12, 2026 12:30
Frequency: Monthly
Consensus: 0.6%
Previous: 0.9%
Source: US Bureau of Labor Statistics
The US Federal Reserve (Fed) has a dual mandate of maintaining price stability and maximum employment. According to such mandate, inflation should be at around 2% YoY and has become the weakest pillar of the central bank’s directive ever since the world suffered a pandemic, which extends to these days. Price pressures keep rising amid supply-chain issues and bottlenecks, with the Consumer Price Index (CPI) hanging at multi-decade highs. The Fed has already taken measures to tame inflation and is expected to maintain an aggressive stance in the foreseeable future.
What to expect in the next CPI data report?
CPI figures for April will reflect the impact of persistently high Oil prices on inflation. Since this is largely anticipated, core inflation figures will help markets gauge whether rising energy costs are spilling over into the broader economy and driving up the prices of other goods and services.
A reading above the market expectation of 0.3% in the monthly core CPI could feed into concerns over high inflation getting entrenched in the economy. Conversely, a print below analysts’ forecast could ease fears over prices getting out of control. Still, even in this latter scenario, investors are unlikely to breathe a sigh of relief because the US-Iran crisis remains unresolved and the lack of naval activity in the Strait of Hormuz continues to pose a significant risk to global energy supply chains.
Minneapolis Federal Reserve (Fed) President Neel Kashkari said the price shock from a prolonged closure of the strait could put inflation expectations at risk and requires a strong policy response. Similarly, St. Louis Fed President Alberto Musalem noted that inflation is meaningfully above the Fed’s target and added that policymakers need to worry about the underlying inflation, along with tariff and Oil shocks.
How could the US Consumer Price Index report affect EUR/USD?
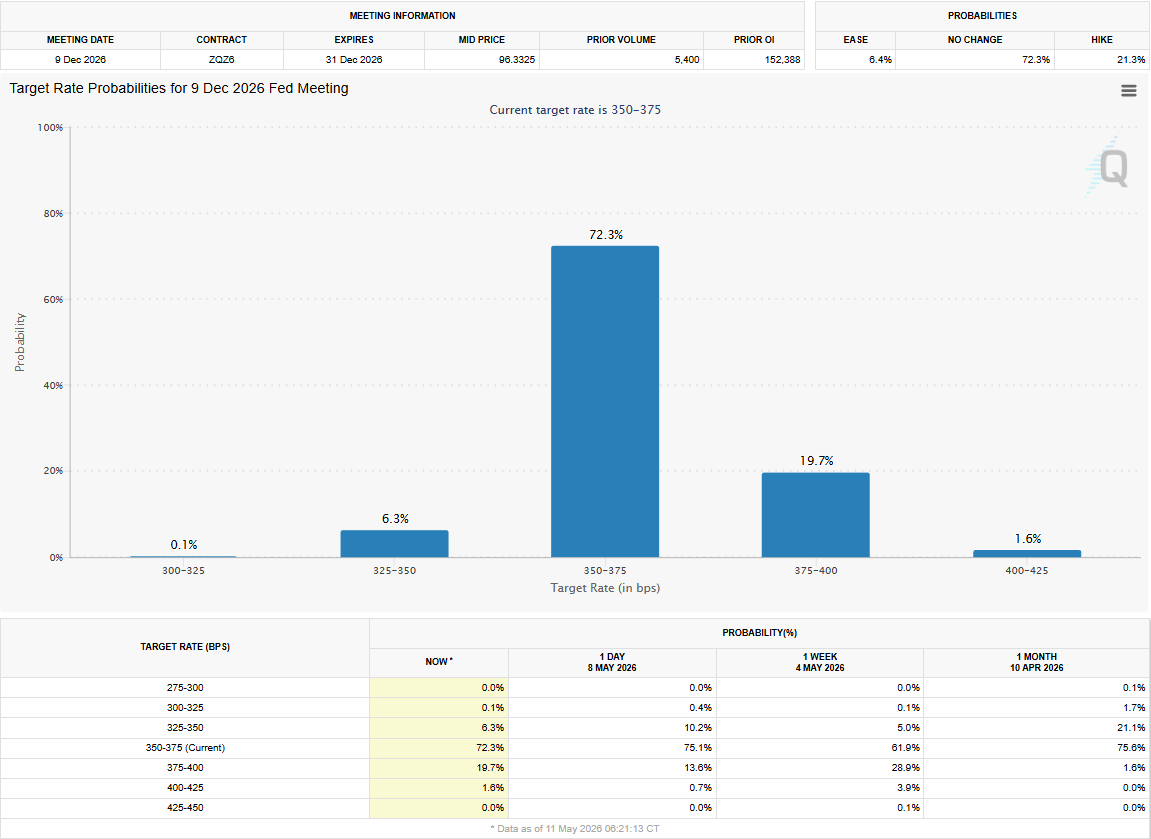
Markets currently see about a 73% chance of the Fed leaving the policy rate unchanged at 3.5%-3.75% by the end of the year, and price in about a 20% probability of a 25 basis points (bps) hike, according to the CME FedWatch Tool.
A stronger-than-forecast monthly core CPI print for April could cause investors to lean toward a rate hike later in the year. In this scenario, the US Dollar (USD) could gather strength with the immediate reaction.
On the other hand, a soft core CPI print could have the opposite effect on the USD’s valuation. However, unless there are any significant developments hinting at the US-Iran conflict coming to an end soon, any negative impact on the USD could remain short-lived.
"Investors will be on heightened alert for the possibility of further delays to the first rate cut – or even an inability to ease in 2H26 altogether – should energy prices rise sharply and persistently due to an escalation or prolongation of the Middle East conflict,” UOB Group’s Alvin Liew explains.
“A broader oil-related price spillover across the CPI basket would materially complicate the inflation outlook, raising the risk that the anticipated year-end cut is pushed into 2027,” Liew elaborates.
Eren Sengezer, FXStreet European Session Lead Analyst, shares a brief technical outlook for EUR/USD.
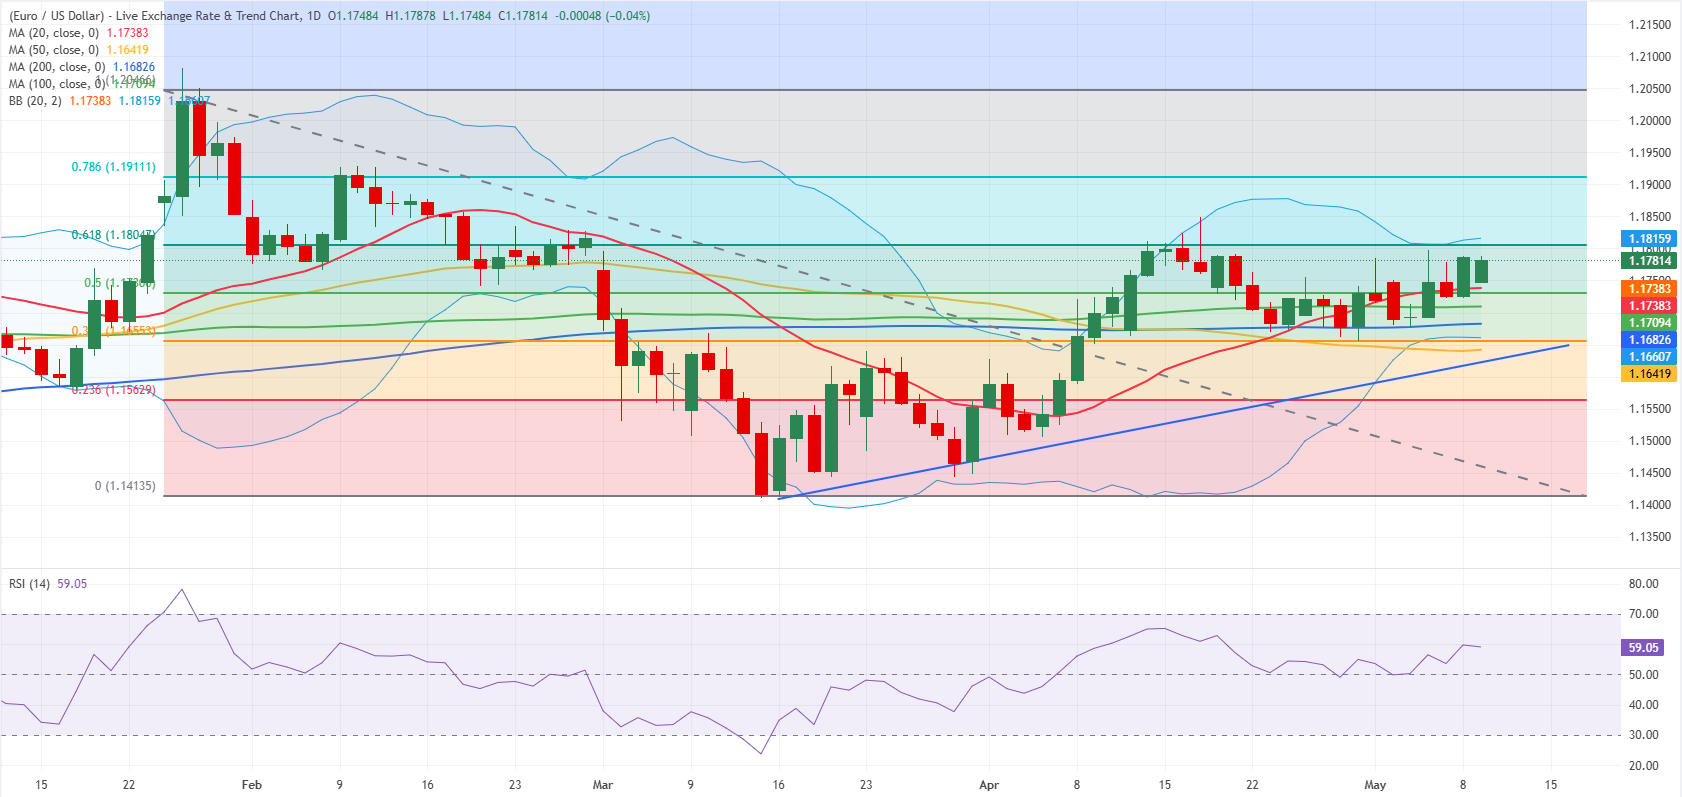
“EUR/USD’s near-term technical outlook points to a bullish stance that lacks strength. The Relative Strength Index (RSI) indicator on the daily chart holds above 50 but retreats after testing 60, and the pair struggles to pull away from the 20-day Simple Moving Average (SMA) despite closing well above it to end the previous week.”
“On the upside, the first resistance area aligns at 1.1800-1.1820, where the upper limit of the Bollinger Band and the Fibonacci 61.8% retracement of the February-April downtrend align. In case EUR/USD manages to stabilize above this region, 1.1900-1.1910 (round level, Fibonacci 78.6% retracement) could be seen as the next hurdle ahead of 1.2000 (psychological level).”
Looking south, a strong support area seems to have formed at 1.1730-1.1680 (Fibonacci 50% retracement, 100-day SMA, 200-day SMA). If EUR/USD drops below the lower limit of this range and starts using it as resistance, technical sellers could take action. In this case, 1.1660 (ascending trend line) could be seen as an interim support level before 1.1560 (Fibonacci 23.6% retracement).”
US Dollar FAQs
The US Dollar (USD) is the official currency of the United States of America, and the ‘de facto’ currency of a significant number of other countries where it is found in circulation alongside local notes. It is the most heavily traded currency in the world, accounting for over 88% of all global foreign exchange turnover, or an average of $6.6 trillion in transactions per day, according to data from 2022. Following the second world war, the USD took over from the British Pound as the world’s reserve currency. For most of its history, the US Dollar was backed by Gold, until the Bretton Woods Agreement in 1971 when the Gold Standard went away.
The most important single factor impacting on the value of the US Dollar is monetary policy, which is shaped by the Federal Reserve (Fed). The Fed has two mandates: to achieve price stability (control inflation) and foster full employment. Its primary tool to achieve these two goals is by adjusting interest rates. When prices are rising too quickly and inflation is above the Fed’s 2% target, the Fed will raise rates, which helps the USD value. When inflation falls below 2% or the Unemployment Rate is too high, the Fed may lower interest rates, which weighs on the Greenback.
In extreme situations, the Federal Reserve can also print more Dollars and enact quantitative easing (QE). QE is the process by which the Fed substantially increases the flow of credit in a stuck financial system. It is a non-standard policy measure used when credit has dried up because banks will not lend to each other (out of the fear of counterparty default). It is a last resort when simply lowering interest rates is unlikely to achieve the necessary result. It was the Fed’s weapon of choice to combat the credit crunch that occurred during the Great Financial Crisis in 2008. It involves the Fed printing more Dollars and using them to buy US government bonds predominantly from financial institutions. QE usually leads to a weaker US Dollar.
Quantitative tightening (QT) is the reverse process whereby the Federal Reserve stops buying bonds from financial institutions and does not reinvest the principal from the bonds it holds maturing in new purchases. It is usually positive for the US Dollar.
(This story was updated on May 12 at 09:02 GMT to reflect a last-minute change in the monthly core CPI expected reading to 0.3% from 0.4%.)
Author
FXStreet Team
FXStreet
Composed of a group of economic journalists and FX experts, the FXStreet content team produces and oversees all content published on FXStreet. It provides a purely journalistic approach to the Forex market.