Crypto Today: Bitcoin, Ethereum, XRP eye short-term recovery amid ETF inflows
- Bitcoin maintains a neutral-to-bullish outlook, holding above the 50-day EMA amid renewed ETF inflows.
- Ethereum builds momentum toward a potential breakout above the 100-day EMA as institutional demand returns.
- XRP holds steady above the $1.00 support, but its upside remains capped by the 50-day EMA and the dynamic SuperTrend line.

Cryptocurrency prices are gaining traction on Monday, with Bitcoin (BTC) trading above $65,000, Ethereum (ETH) holding the near-term $1,900 support and Ripple (XRP) hovering above the critical $1.00 demand zone. The broad recovery comes amid capital inflows through US-listed Exchange-Traded Funds (ETFs).
BTC, ETH and XRP attract ETF inflows
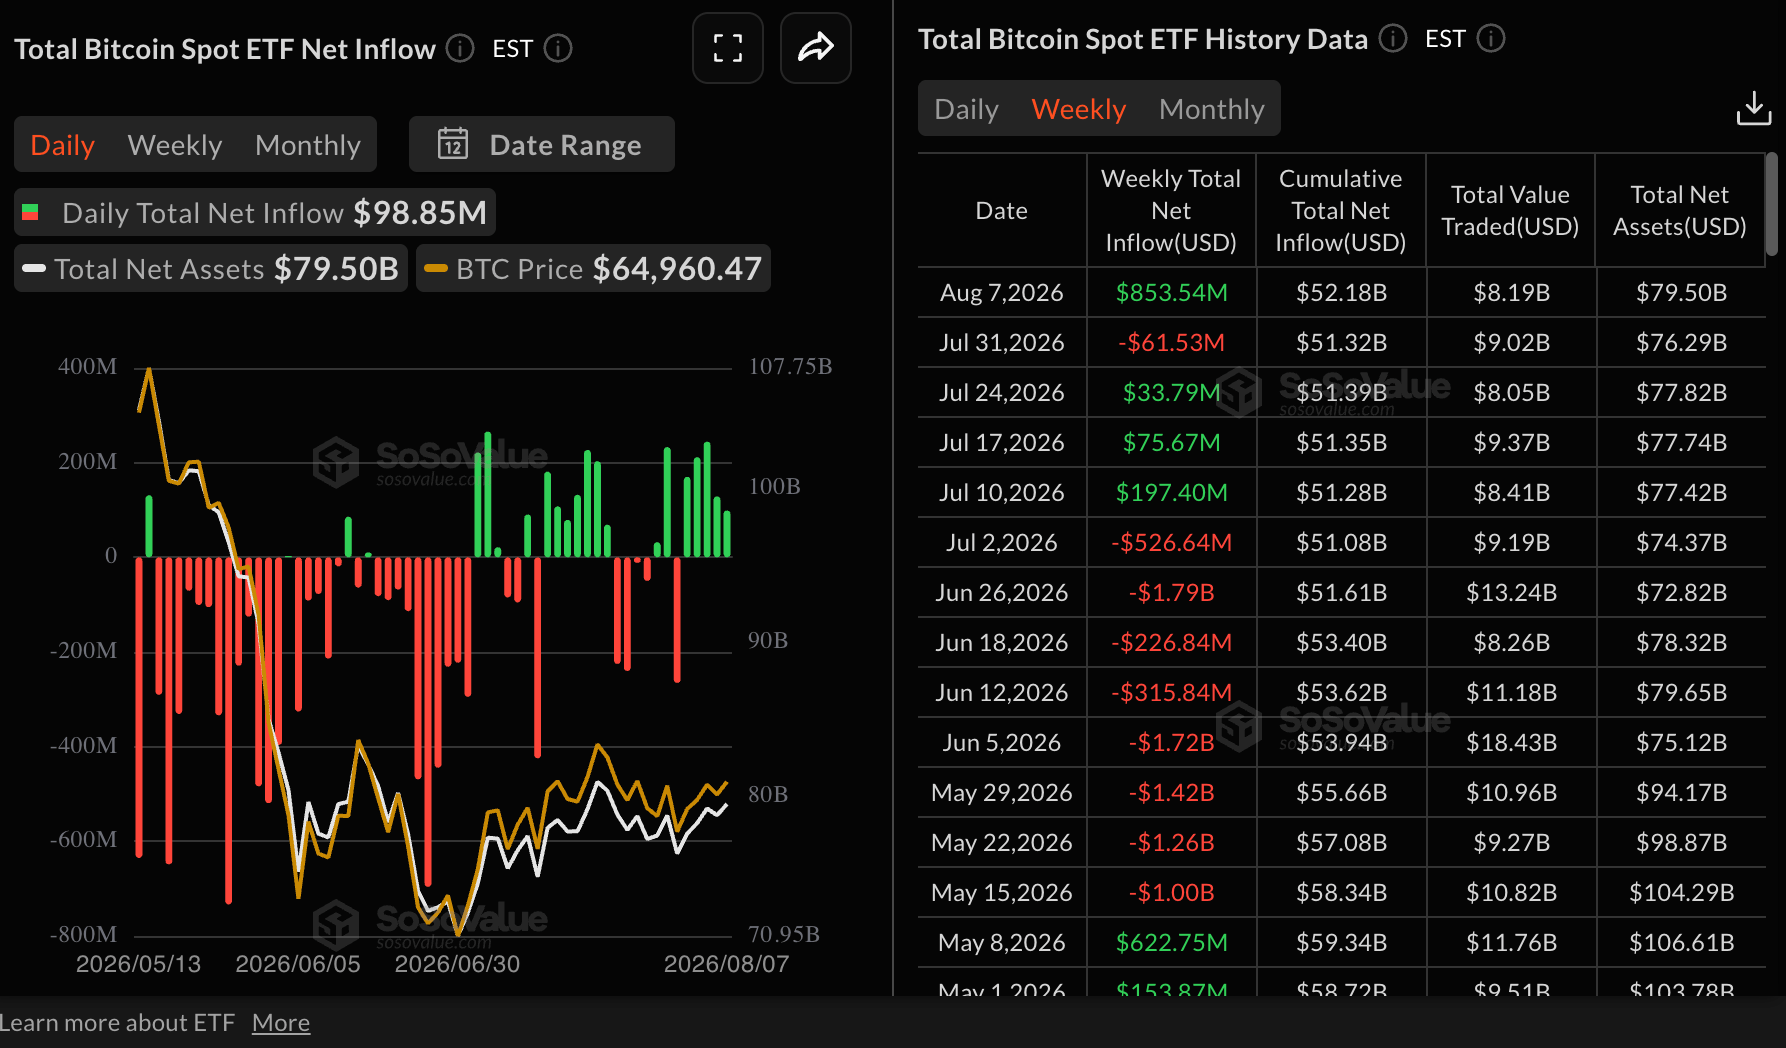
Digital investment products remained relatively bullish throughout last week, with Bitcoin recording roughly $853 million in inflows through Friday. This marks the return of institutional investors, following approximately $62 million in outflows in the previous week. Cumulative inflows average $52.18 billion, with net assets at $79.5 billion.
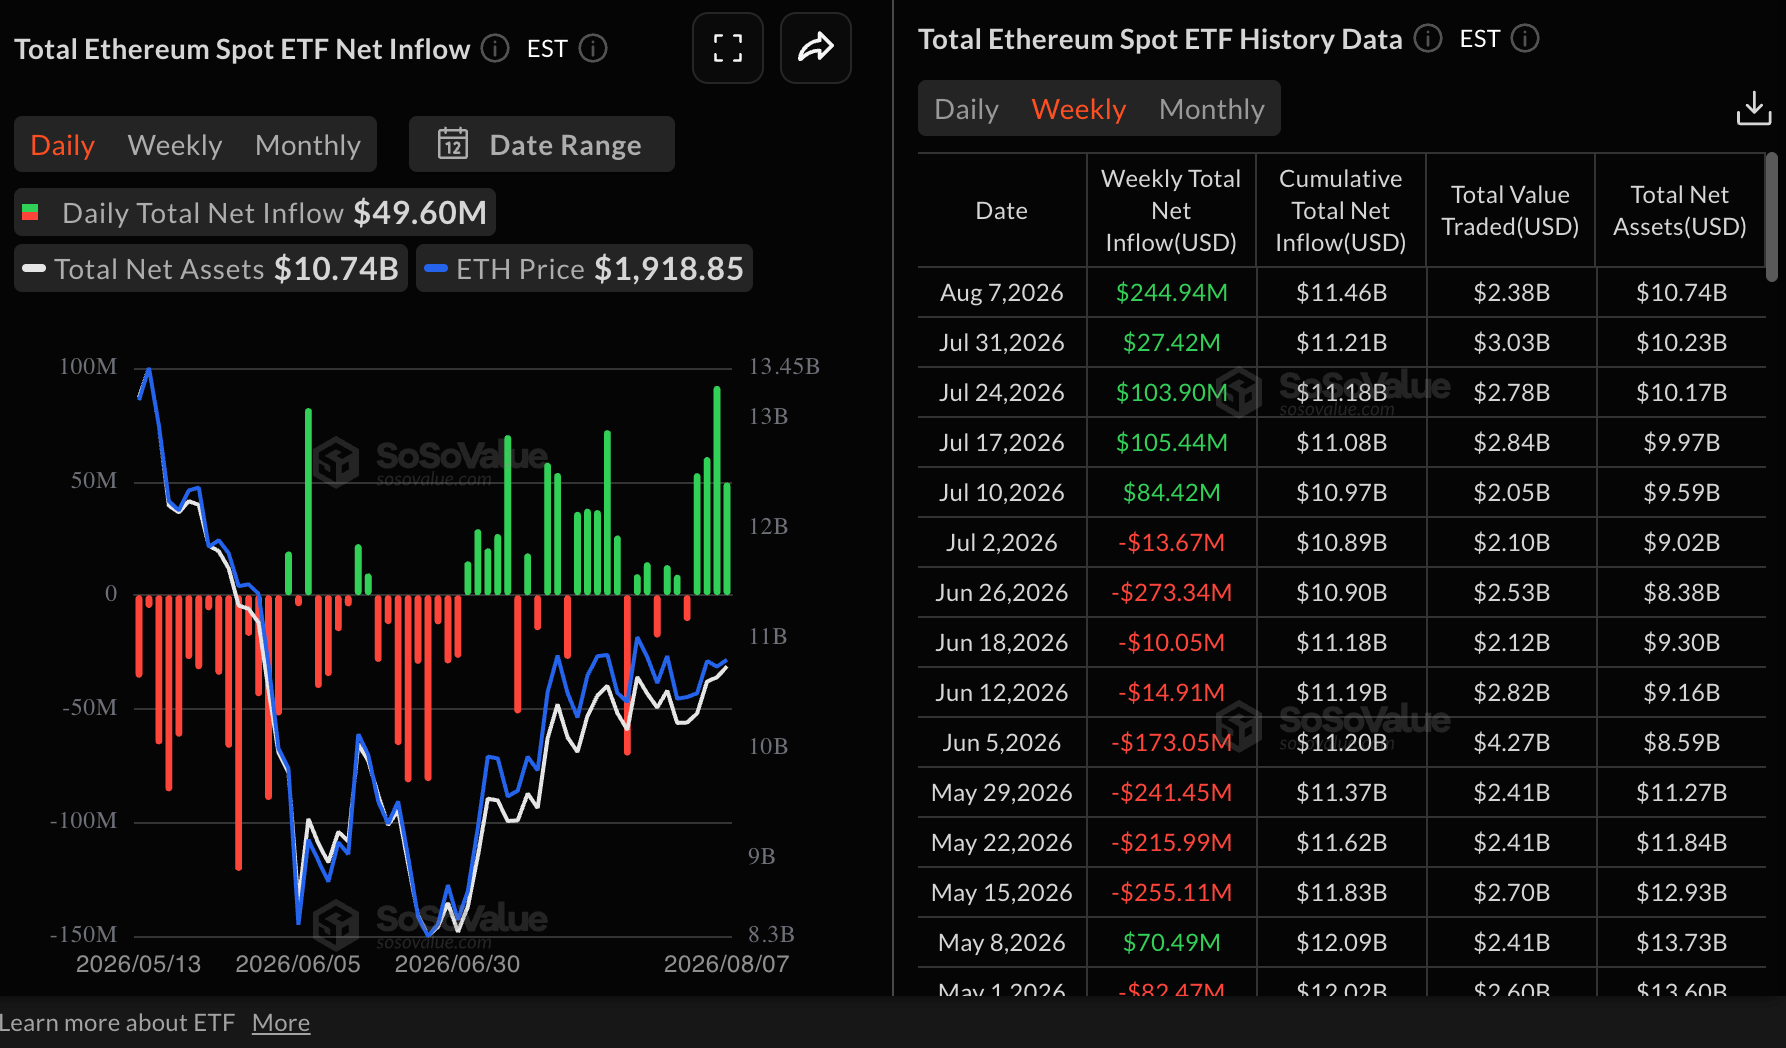
Ethereum spot ETFs extended their bullish streak for a fifth consecutive week, attracting nearly $245 million in inflows through Thursday. If sustained, inflows could offset the selling pressure, raising the odds of an extended recovery beyond $2,000.
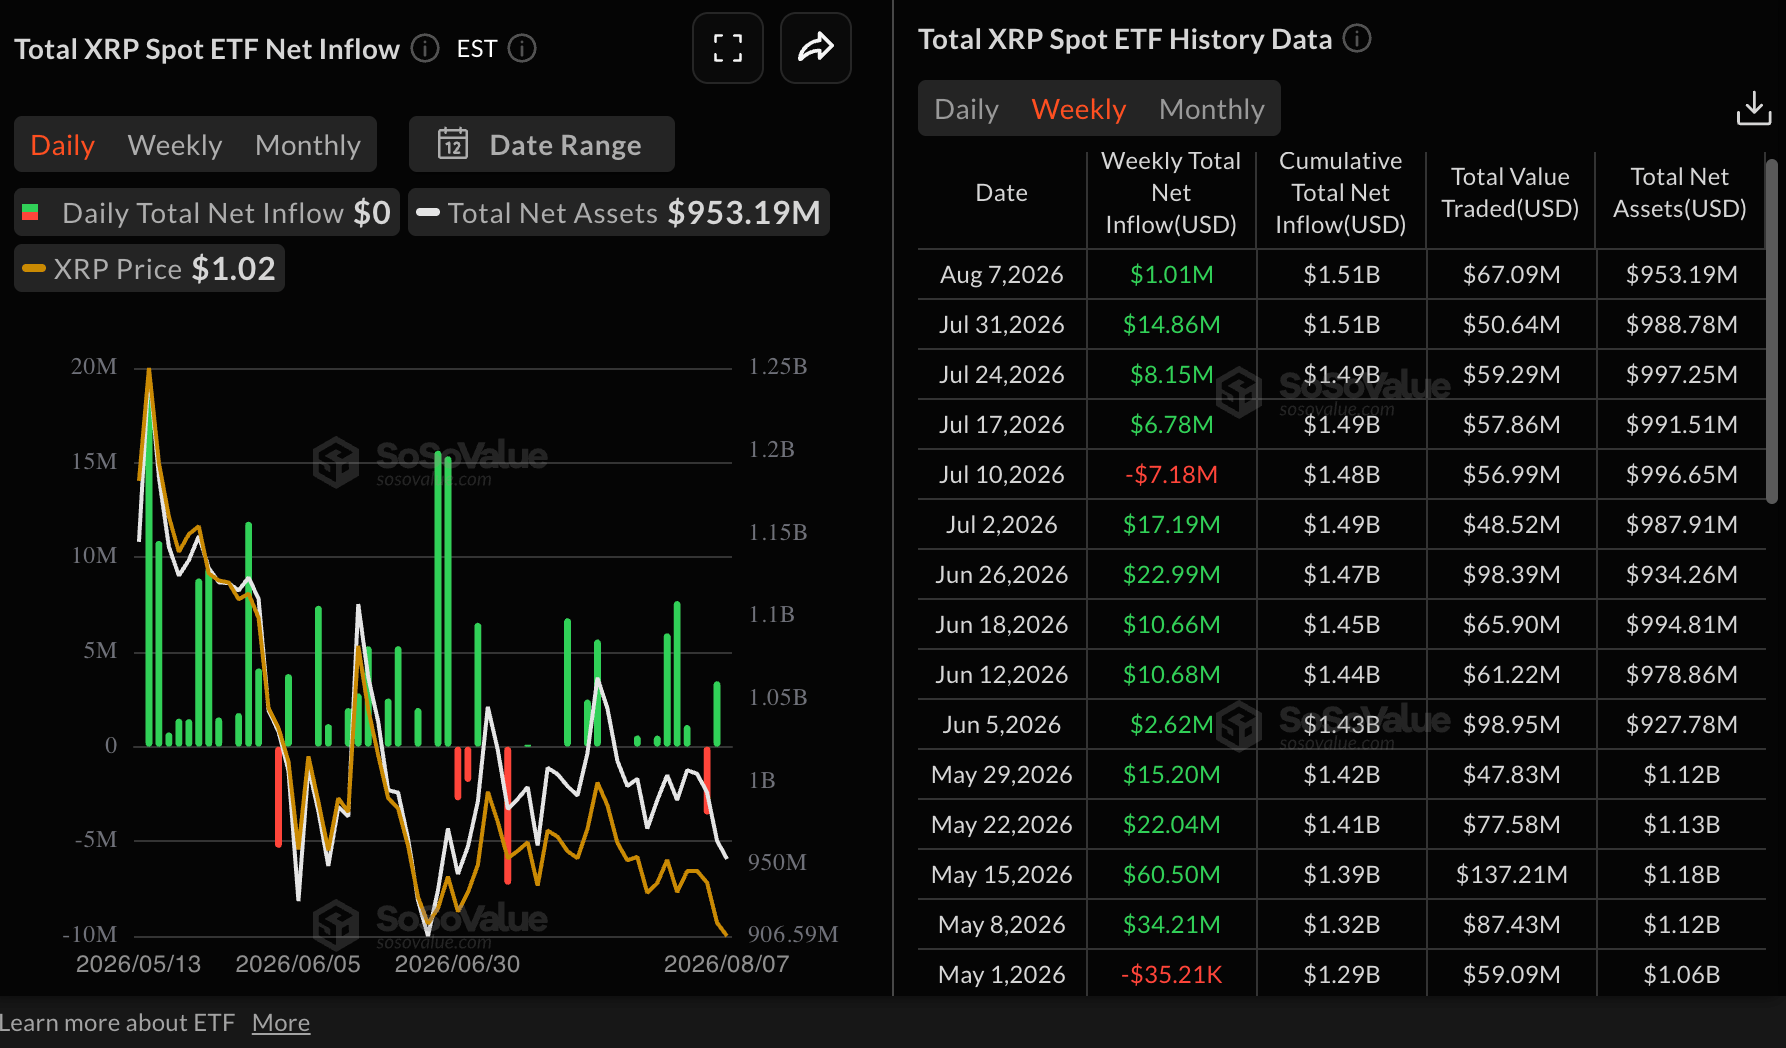
US-listed XRP spot ETFs experienced inflows of $1.01 million last week, building on the bullish momentum printed over the last few weeks. Cumulative inflows stand at $1.51 billion, with net assets under management at $953 million.
Technical Analysis: Bitcoin bulls retain control
Bitcoin trades at $64,951, holding a neutral-to-slightly bullish stance as it sits above the 50-day Exponential Moving Average (EMA) near $64,663, yet remains capped beneath the 100-day EMA around $66,978 and the 200-day EMA close to $73,501. The price action respects an upward-sloping trendline with a break reference near $63,293, while the Parabolic SAR trails well below price around $62,275, reinforcing a supportive structure.
Momentum readings lean constructive, with the Relative Strength Index (RSI) hovering near 55 and the Moving Average Convergence Divergence (MACD) back in positive territory with a mildly improving profile, suggesting buyers still have a slight edge as long as these underlying supports hold.
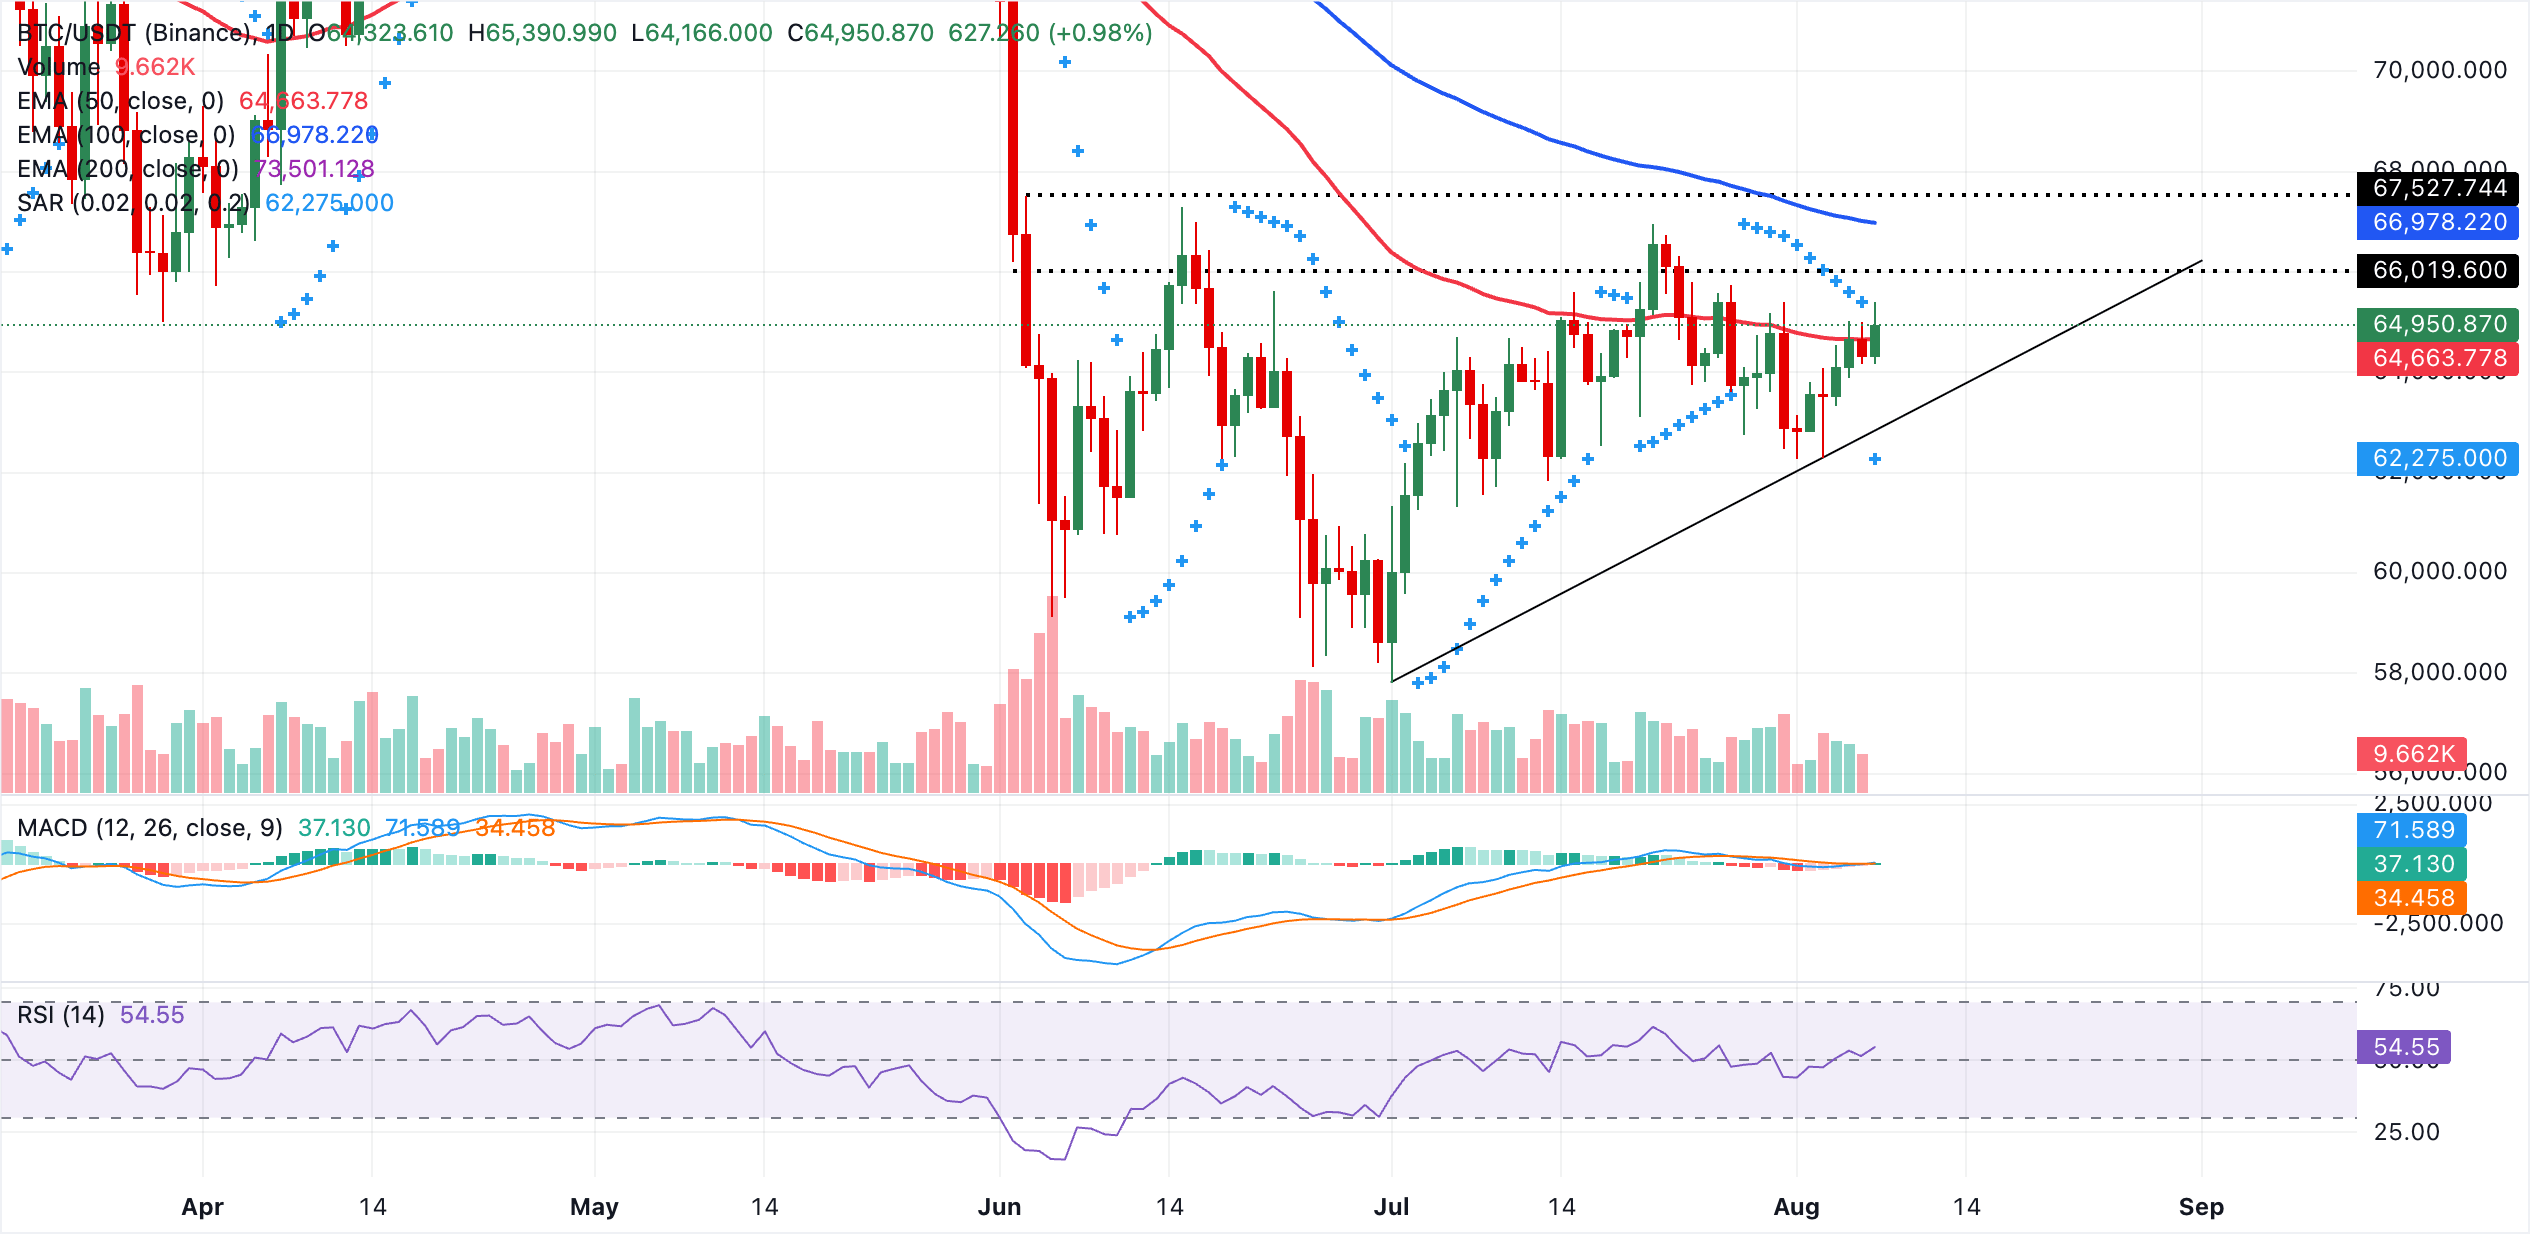
On the topside, initial resistance appears at the 100-day EMA around $66,978, and a sustained break above this barrier would expose the more significant 200-day EMA near $73,501 as the next upside objective. On the downside, immediate support is defined by the 50-day EMA at about $64,664, followed by the rising trendline region around $63,293, with the Parabolic SAR support down near $62,275 acting as a deeper buffer. A daily close below this cluster would undermine the current constructive tone and shift the bias back in favor of sellers.
Altcoins technical outlook: Ethereum and XRP uphold constructive bias
Ethereum trades at $1,928, holding a constructive near-term bias as price sits above the 50-day and 100-day Exponential Moving Averages (EMAs) clustered around $1,865 and $1,927, respectively. This positioning suggests dip-buying interest remains intact despite ETH still trading well below the 200-day EMA, now a broader bearish barrier near $2,162.
The RSI around 58 reinforces a mildly bullish tone, while the slightly negative MACD hints that upside momentum is positive but not yet impulsive.
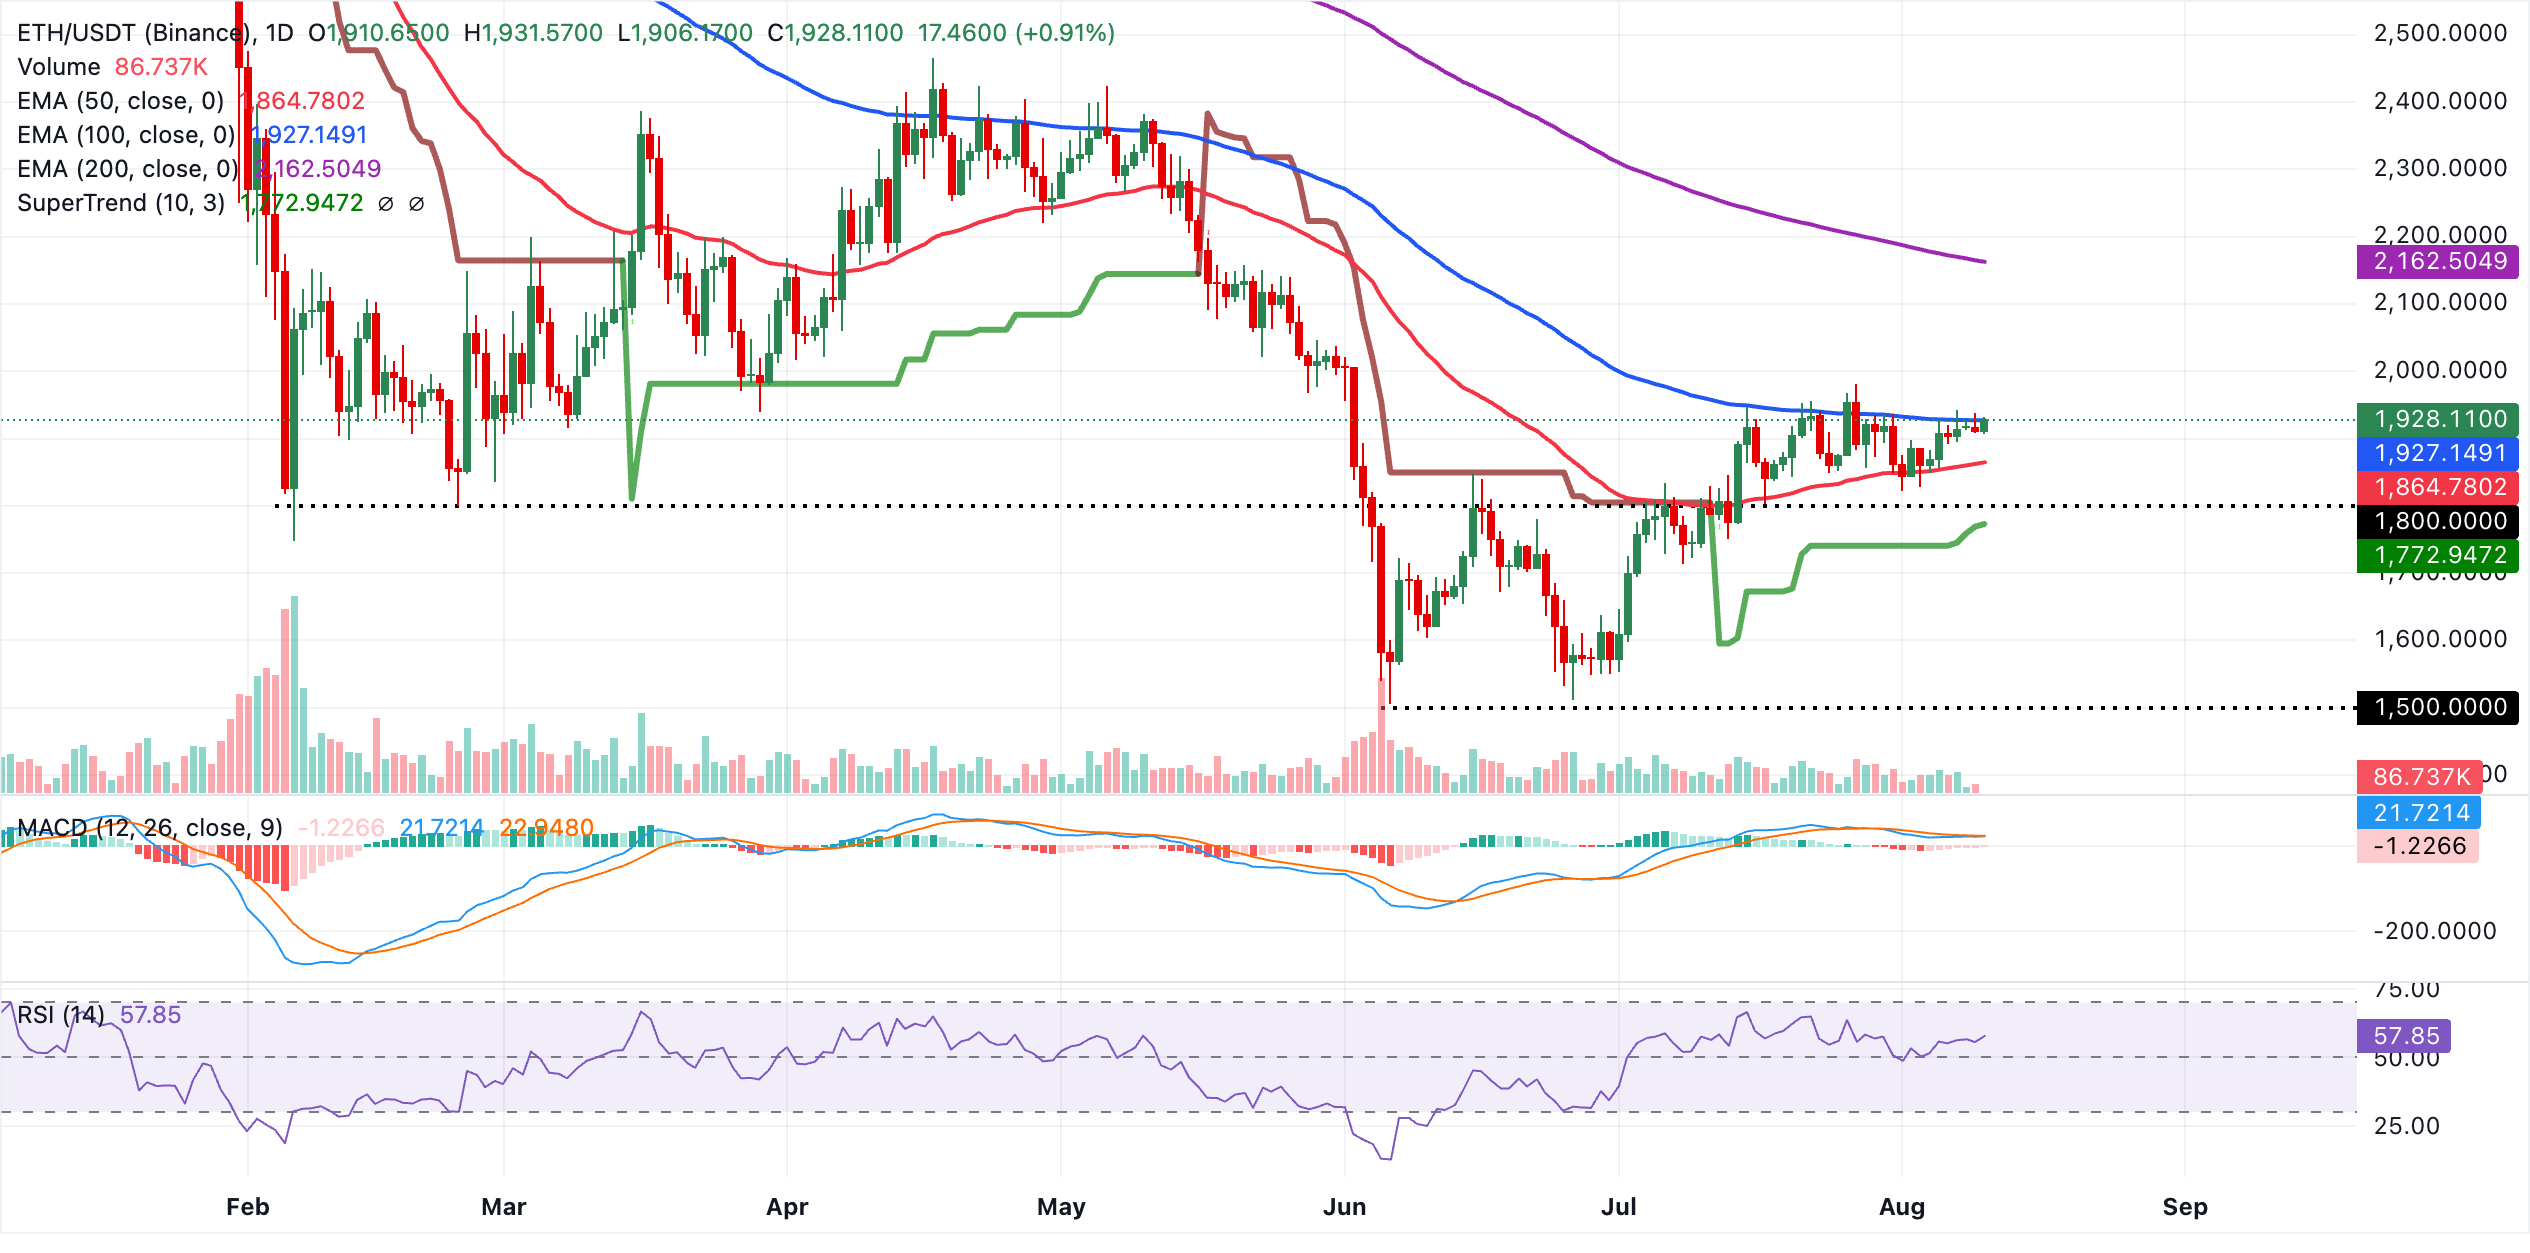
On the downside, immediate support lies at the 100-day EMA near $1,927, ahead of the 50-day EMA around $1,865, with the SuperTrend line providing a deeper safety net close to $1,773. As long as ETH holds above these layers of demand, bulls may continue probing higher, though a sustained break above the distant 200-day EMA at $2,162 would be needed to unlock a more decisive bullish phase.
XRP, on the other hand, trades at $1.03, keeping a bearish near-term tone as price holds below the 50-day, 100-day and 200-day Exponential Moving Averages (EMAs). The 50-day EMA around $1.10 is the first dynamic cap, reinforced by the SuperTrend line near $1.12, while the longer EMAs at $1.18 and $1.37 sit higher as broader trend barriers.
Momentum conditions stay weak, with the RSI hovering near 39 and the MACD in negative territory, which together hint that sellers retain control despite the recent stabilization.
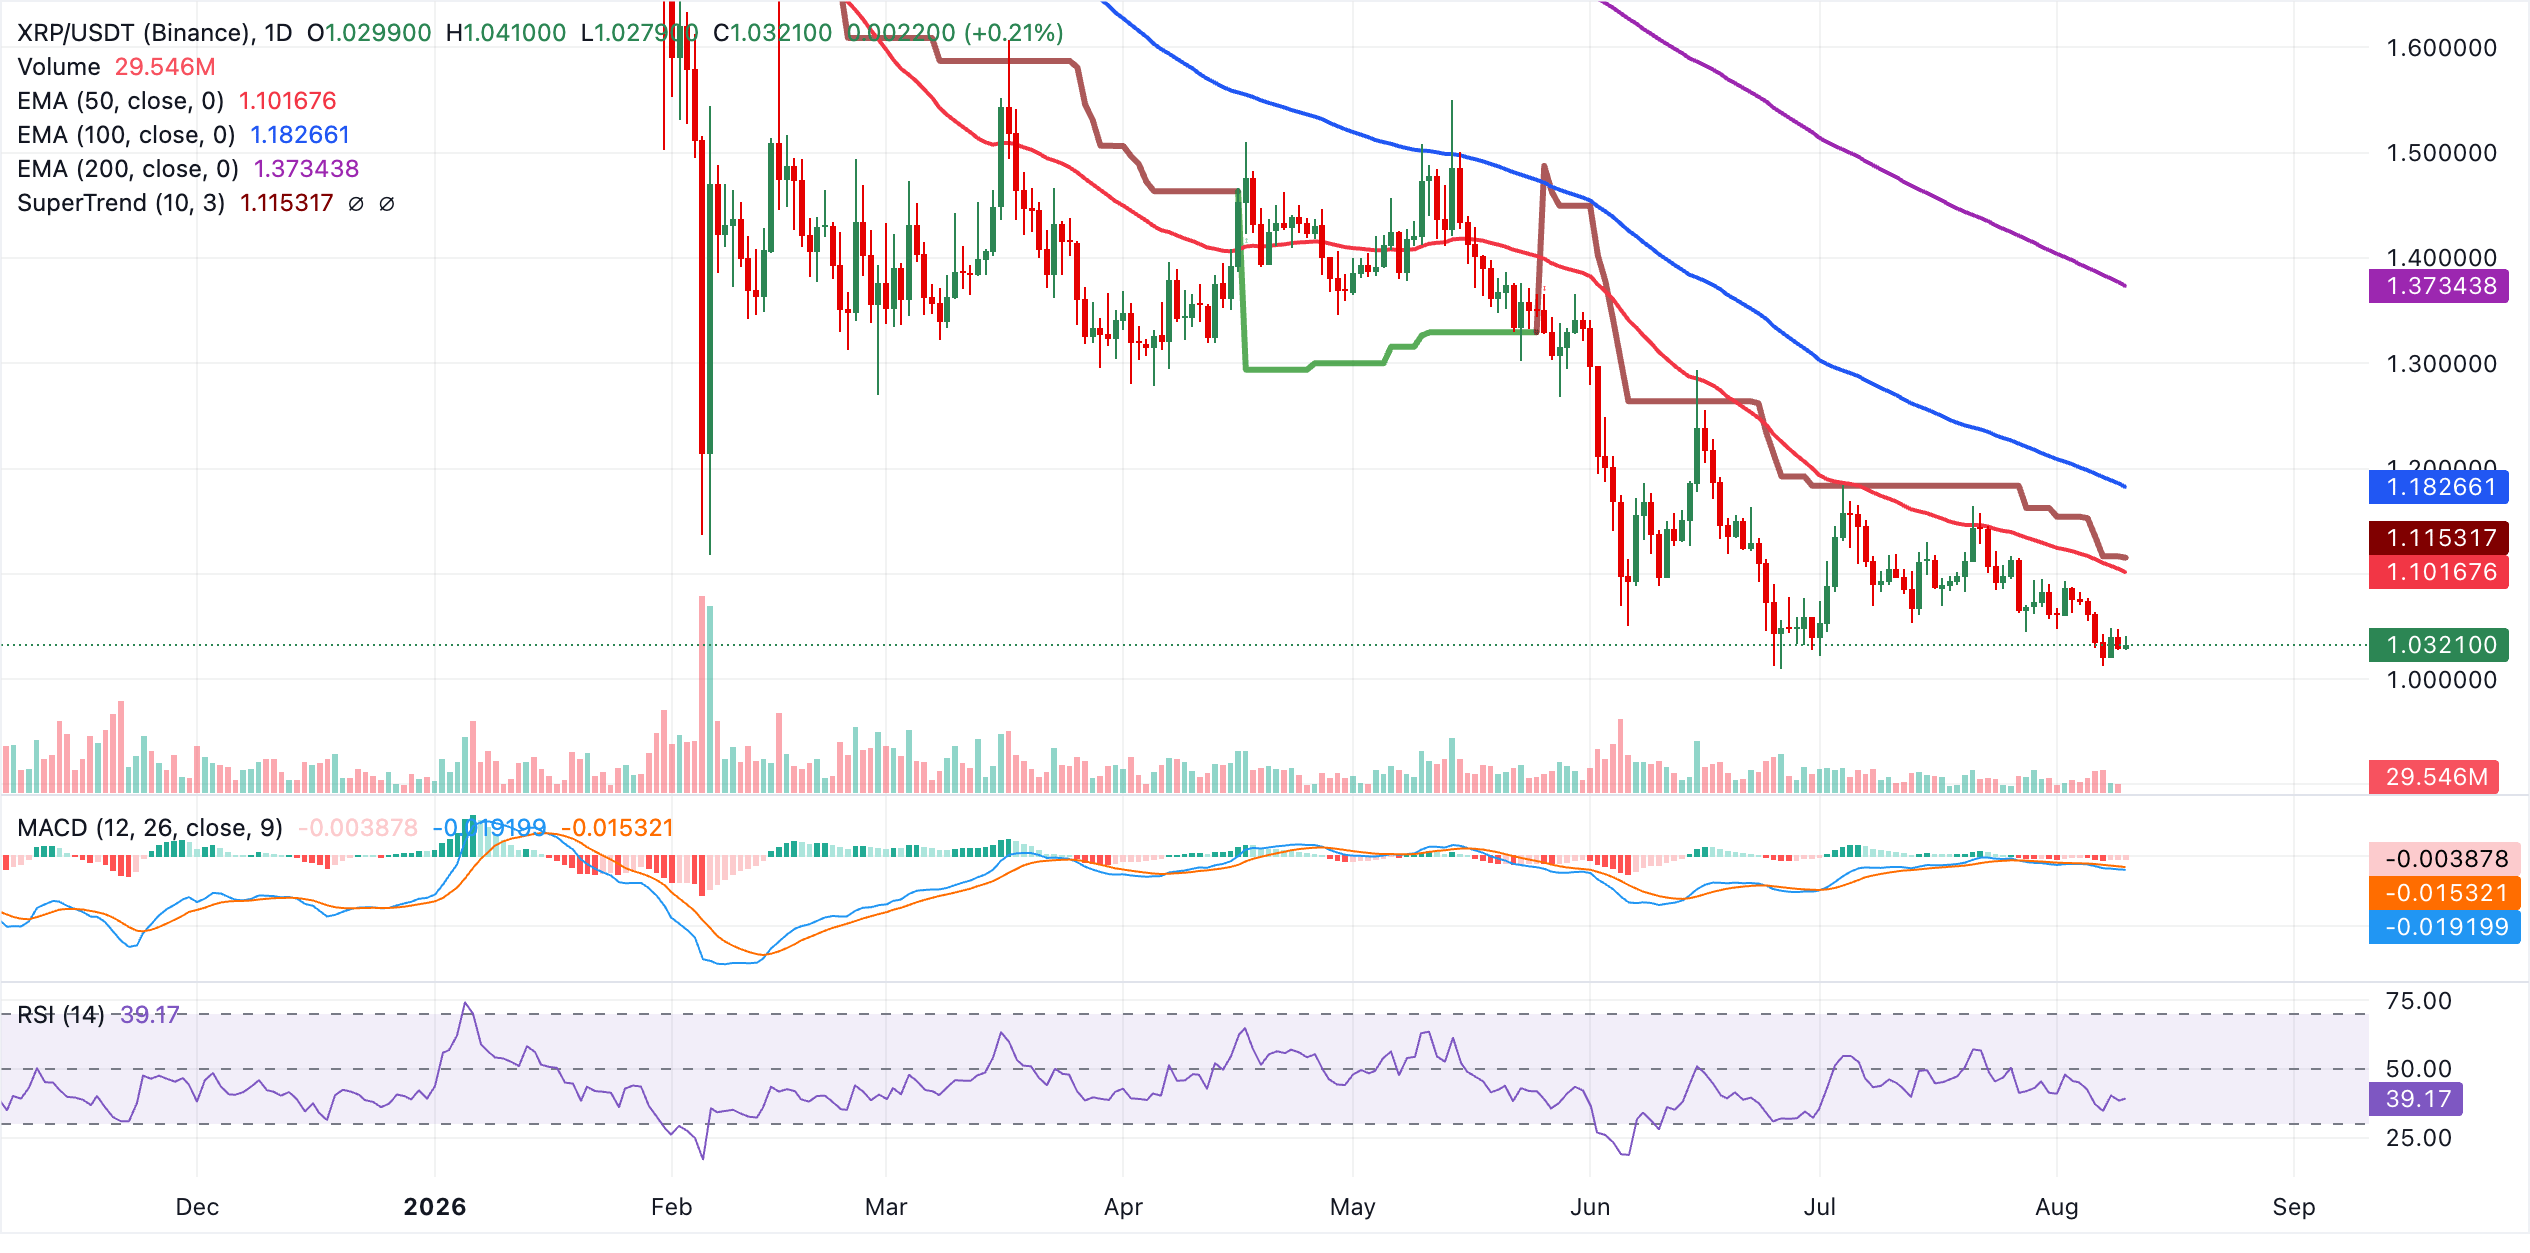
Immediate resistance lies at the 50-day EMA around $1.10, followed by the SuperTrend level at $1.12, where renewed selling could emerge if price attempts a rebound. A sustained break above these would expose the 100-day EMA near $1.18 and then the 200-day EMA around $1.37 as subsequent upside hurdles. Any further slide would leave XRP relying on uncharted horizontal or prior price-based floors, keeping downside risks present while it trades under the clustered moving averages.
(The technical analysis of this story was written with the help of an AI tool. Know more.)
Crypto ETF FAQs
An Exchange-Traded Fund (ETF) is an investment vehicle or an index that tracks the price of an underlying asset. ETFs can not only track a single asset, but a group of assets and sectors. For example, a Bitcoin ETF tracks Bitcoin’s price. ETF is a tool used by investors to gain exposure to a certain asset.
Yes. The first Bitcoin futures ETF in the US was approved by the US Securities & Exchange Commission in October 2021. A total of seven Bitcoin futures ETFs have been approved, with more than 20 still waiting for the regulator’s permission. The SEC says that the cryptocurrency industry is new and subject to manipulation, which is why it has been delaying crypto-related futures ETFs for the last few years.
Yes. The SEC approved in January 2024 the listing and trading of several Bitcoin spot Exchange-Traded Funds, opening the door to institutional capital and mainstream investors to trade the main crypto currency. The decision was hailed by the industry as a game changer.
The main advantage of crypto ETFs is the possibility of gaining exposure to a cryptocurrency without ownership, reducing the risk and cost of holding the asset. Other pros are a lower learning curve and higher security for investors since ETFs take charge of securing the underlying asset holdings. As for the main drawbacks, the main one is that as an investor you can’t have direct ownership of the asset, or, as they say in crypto, “not your keys, not your coins.” Other disadvantages are higher costs associated with holding crypto since ETFs charge fees for active management. Finally, even though investing in ETFs reduces the risk of holding an asset, price swings in the underlying cryptocurrency are likely to be reflected in the investment vehicle too.
Author

John Isige
FXStreet
John Isige is a seasoned cryptocurrency journalist and markets analyst committed to delivering high-quality, actionable insights tailored to traders, investors, and crypto enthusiasts. He enjoys deep dives into emerging Web3 tren


