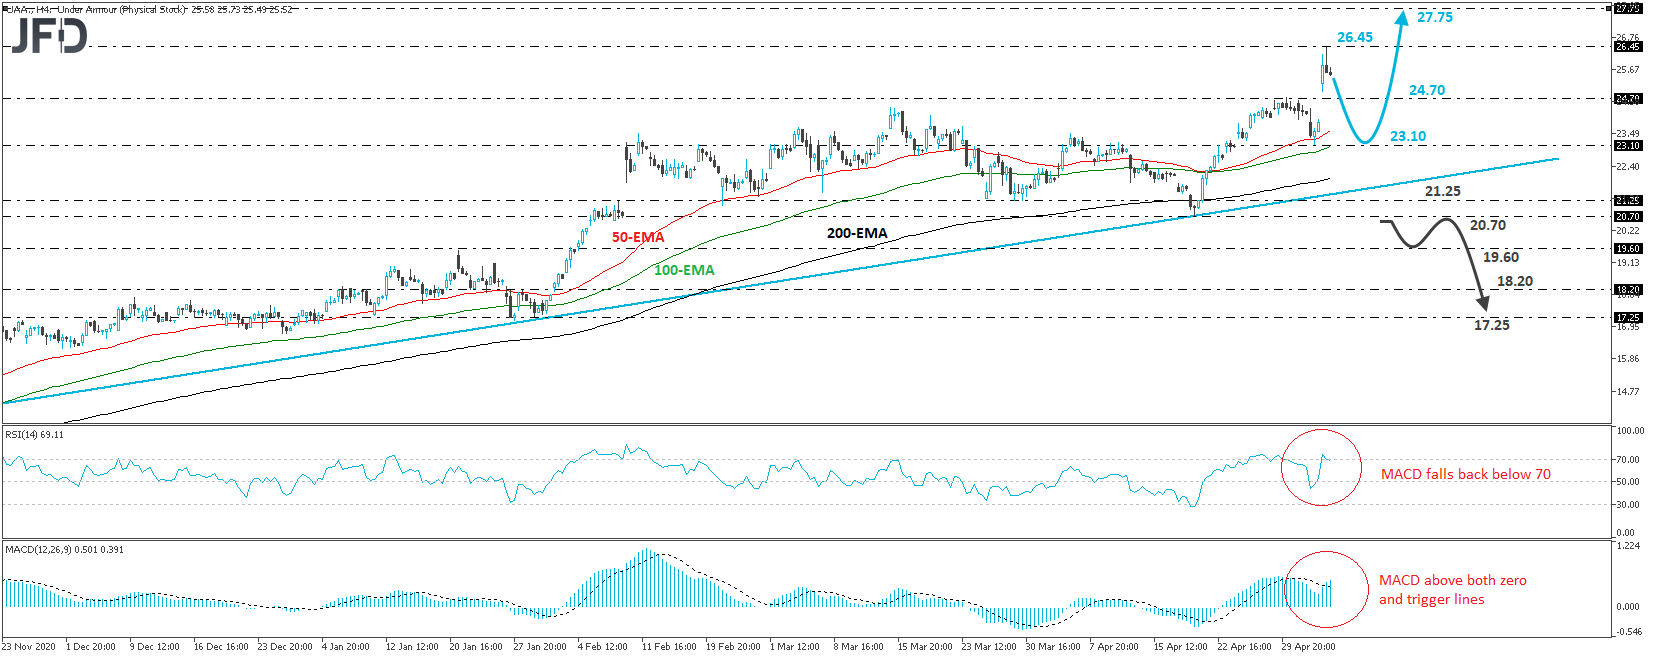
Under Armour (NYSE: UAA) opened with a positive gap yesterday, to trade above the 24.70 barriers, marked by the highs of last Thursday and Friday. That said, the advance was stopped near the 26.45 level, and then, the stock retreated somewhat. Overall, Under Armour trades above the upside support line drawn from the low of October 28th, and thus, we would consider the near-term outlook to be positive.
The current retreat may continue for a while more, even back below the 24.70 barriers. However, as long as the price stays above the aforementioned upside line, we would see decent chances for market participants to re-enter the action, perhaps from hear the 23.10 support, marked by Tuesday’s low. We may then see a recovery back near 26.45, where a decisive break may see scope for extensions towards the highs of July 24th and 25th, 2019, at around 27.75.
Looking at our short-term oscillators, we see that the RSI fell back below its 70 line, while the MACD, although above both its zero and trigger lines, shows signs that it could top as well. Both indicators detect decelerating upside speed and support the notion for some further retreat before the next leg north.
In order to start examining the case of a bearish reversal, we would like to see a dip below 20.70. This would not only take the stock below the pre-discussed upside line, but it would also confirm a forthcoming lower low on the daily chart. Under Armour could then fall towards the 18.60 zone, the break of which could pave the way towards the 18.20 level or the 17.25 barrier, defined as supports by the inside swing low of January 28th, and the low of the next day, respectively.
JFDBANK.com - One-stop Multi-asset Experience for Trading and Investment Services
The content we produce does not constitute investment advice or investment recommendation (should not be considered as such) and does not in any way constitute an invitation to acquire any financial instrument or product. JFD Group, its affiliates, agents, directors, officers or employees are not liable for any damages that may be caused by individual comments or statements by JFD Group analysts and assumes no liability with respect to the completeness and correctness of the content presented. The investor is solely responsible for the risk of his investment decisions. Accordingly, you should seek, if you consider appropriate, relevant independent professional advice on the investment considered. The analyses and comments presented do not include any consideration of your personal investment objectives, financial circumstances or needs. The content has not been prepared in accordance with the legal requirements for financial analyses and must therefore be viewed by the reader as marketing information. JFD Group prohibits the duplication or publication without explicit approval.
72,99% of the retail investor accounts lose money when trading CFDs with this provider. You should consider whether you can afford to take the high risk of losing your money. Please read the full Risk Disclosure: https://www.jfdbank.com/en/legal/risk-disclosure
Recommended content
Editors’ Picks
USD/JPY jumps above 156.00 on BoJ's steady policy

USD/JPY has come under intense buying pressure, surging past 156.00 after the Bank of Japan kept the key rate unchanged but tweaked its policy statement. The BoJ maintained its fiscal year 2024 and 2025 core inflation forecasts, disappointing the Japanese Yen buyers.
AUD/USD consolidates gains above 0.6500 after Australian PPI data

AUD/USD is consolidating gains above 0.6500 in Asian trading on Friday. The pair capitalizes on an annual increase in Australian PPI data. Meanwhile, a softer US Dollar and improving market mood also underpin the Aussie ahead of the US PCE inflation data.
Gold price flatlines as traders look to US PCE Price Index for some meaningful impetus

Gold price lacks any firm intraday direction and is influenced by a combination of diverging forces. The weaker US GDP print and a rise in US inflation benefit the metal amid subdued USD demand. Hawkish Fed expectations cap the upside as traders await the release of the US PCE Price Index.
Stripe looks to bring back crypto payments as stablecoin market cap hits all-time high

Stripe announced on Thursday that it would add support for USDC stablecoin, as the stablecoin market exploded in March, according to reports by Cryptocompare.
US economy: Slower growth with stronger inflation

The US Dollar strengthened, and stocks fell after statistical data from the US. The focus was on the preliminary estimate of GDP for the first quarter. Annualised quarterly growth came in at just 1.6%, down from the 2.5% and 3.4% previously forecast.
