|

Uncertain recovery: Projections indicate continued decline in Ford’s stock price

Ford Motor Company (F) is an American multinational automobile manufacturer headquartered in Dearborn, Michigan, United States. It was founded by Henry Ford and incorporated on June 16, 1903. The company sells automobiles and commercial vehicles under the Ford brand, and luxury cars under its Lincoln luxury brand.

FORD (F) daily chart August 2024

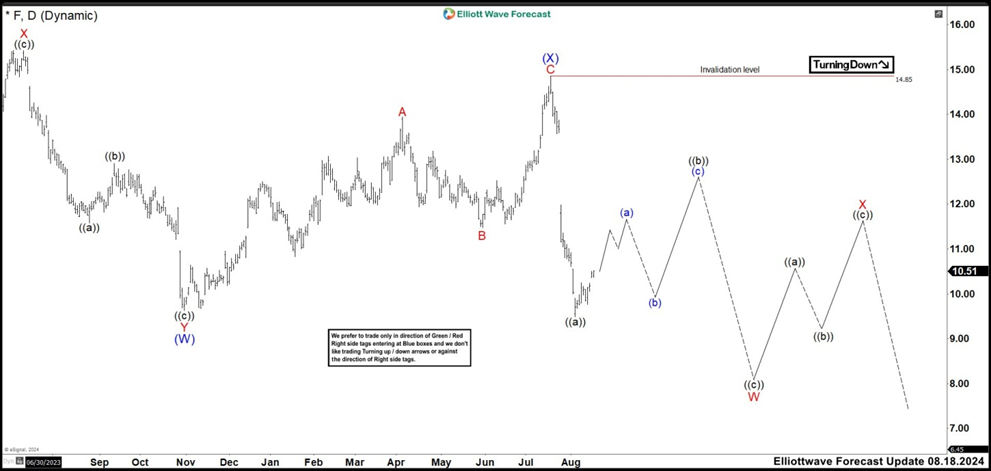
We have been calling Ford bearish since it ended a wave ((X)) at 16.68 high. Since then, the market continued lower and we are expecting a double correction (W), (X), (Y) to complete wave ((Y)). Down from August 2022 high, we can see 7 swings lower developing a double correction structure ending wave (W) at 9.63 low. A new rally started from wave (W) low to build a structure of 3 swings as wave (X) ending at 14.85 high. 

FORD (F) daily chart February 2025 

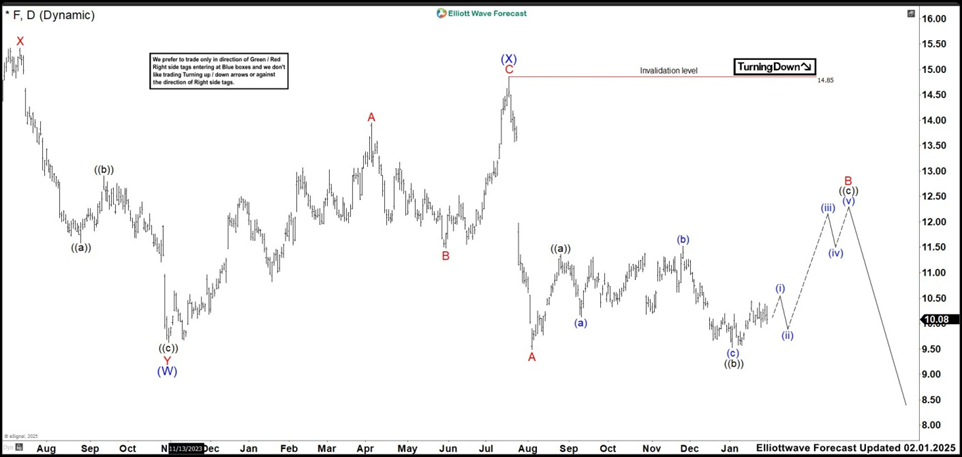
After a few days, F opened with a big gap that would eventually break the low of wave (W). This suggested that we should at least see 3 more waves down to finish the bearish cycle. In the last few months, the market has been moving sideways, so we have adjusted the count based on the new structure. Therefore, we have labeled the strong drop from wave (X) as A ending at 9.49 low. The structure formed from here could be a flat correction (3-3-5). For that, we need to see a rally to 11.86 – 12.58 area to complete wave B and then resuming lower in wave C of (Y). We still expect more downside in the stock and it could drop to 7.79 – 3.43 area. We do NOT recommend to buy near term in this possible wave ((c)) of B. The trend is bearish against 14.85 high. Trade smart!

Author

Elliott Wave Forecast Team

Elliott Wave Forecast Team

ElliottWave-Forecast.com

More from Elliott Wave Forecast Team
Share:

Markets move fast. We move first.

Orange Juice Newsletter brings you expert driven insights - not headlines. Every day on your inbox.

By subscribing you agree to our Terms and conditions.

Editor's Picks

EUR/USD trims gains, nears 1.1700

The EUR/USD pair eases in the American afternoon and approaches the 1.1700 mark. The pair surged earlier in the day after the ECB left interest rates unchanged and upwardly revised inflation and growth figures. The US CPI rose 2.7% YoY in November, nearing Fed’s goal.

GBP/USD steadies below 1.3400 as traders digest BoE policy update and US inflation data

The GBP/USD pair stalls the previous day's pullback from the vicinity of mid-1.3400s and a nearly two-month high, though it struggles to attract meaningful buyers during the Asian session on Friday. Spot prices currently trade around the 1.3380-1.3385 region, up only 0.05% for the day, amid mixed cues.

Gold edges lower despite Fed rate cut hopes on cooling US inflation

Gold price declines to below $4,350 during the early Asian trading hours on Friday. The precious metal edges lower due to some profit-taking and weak long liquidation from shorter-term futures traders. 

Bitcoin, Ethereum, XRP face sharp volatility as US posts lowest inflation rate in years

The latest inflation report released on Thursday in the United States sparked a wave of volatility in the crypto markets. The US Consumer Price Index rose 2.7% YoY in November, below forecasts of 3.1%, and lower than September's 3.0% reading, according to the Bureau of Labour Statistics.

Bank of England cuts rates in heavily divided decision

The Bank of England has cut rates to 3.75%, but the decision was more hawkish than expected, leaving market rates higher and sterling slightly stronger. It's a close call whether the Bank cuts again in February or March.

Ripple holds $1.82 support as low retail demand weighs on the token

Ripple (XRP) is trading between a key support at $1.82 and resistance at $2.00 at the time of writing on Thursday, reflecting the lethargic sentiment in the broader cryptocurrency market.