TSLA Stock Price and Forecast: Tesla drives into light volume zone above $1,140
- Tesla posts a huge rally on Monday as markets overlook omicron.
- TSLA stock rallies over 5% to close at $1,136.99.
- Tesla is on course for more record highs if the market can hold its nerve.

UPDATE: TSLA shares jumped 2.3% to $1,163 at Tuesday's open. This pushes Tesla above the $1,140 area that features light volume and could give traders access to fresh all-time highs.
Tesla rallied strongly on Monday as the Friday panic that gripped global equity markets was forgotten. A combination of bullish commentary from Goldman Sachs, the South Africans claiming Omicron was resulting in mild symptoms, and Pfizer saying it expected its vaccine offered at least some protection against the new strain all combined to send equity markets firmly higher on Monday.
We question whether this will continue. Volatility may be the theme of the weeks ahead, which we alluded to in our daily note yesterday. Tesla as a high beta name naturally outperformed, and the Tesla bull just keeps on running. Multiple headwinds exist, especially CEO Elon Musk selling stock. Tesla received some low scores for reliability in the latest Consumerreports.org survey, but the stock continues to remain strong. Best not to fight such a strong trend.
Tesla (TSLA) stock news
Options have been a huge driver of the Tesla stock performance so far in 2021. With this recent spike in the VIX, buying Tesla call options just became a lot more expensive, so this may actually serve to slow the rally. Theta (time decay) is now also much higher, so buying call options in Tesla has higher intrinsic and time-related issues.
Elon Musk tweeted on Monday that he will provide an updated timeline on the long-awaited Tesla Cybertruck on the next earnings call. This is due on Jan 25, 2022. Elon Musk also referred to the nightmare supply chain issues in 2021.
Tesla (TSLA) stock forecast
Tesla remains elevated, and the 30-minute chart below shows strong short-term support at $1,063. A break there and the next support is then the psychological $1,000. A break above $1,140 is into a zone of light volume, which means less resistance until all-time highs.
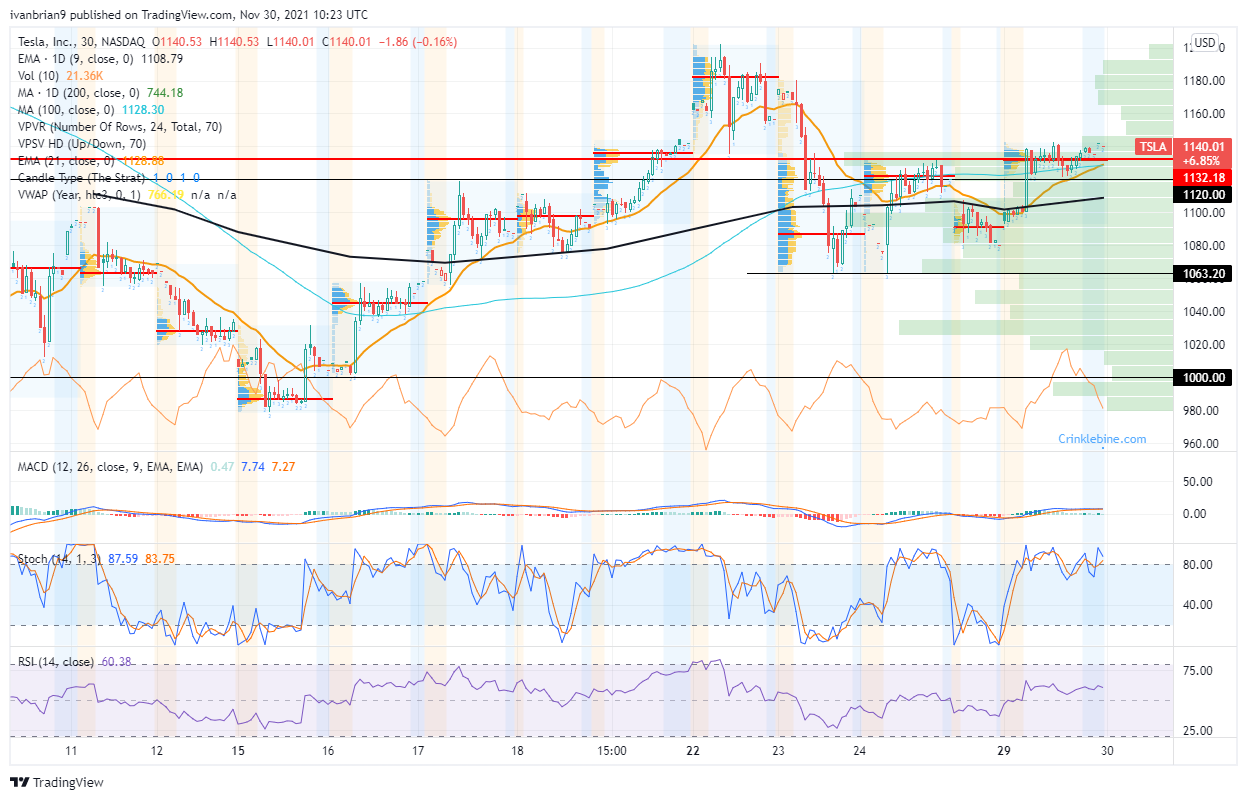
TSLA 30-minute chart
The daily chart is now more interesting though with the formation of a continuation triangle. This should see a breakout higher if the theory holds, but they do not always work.
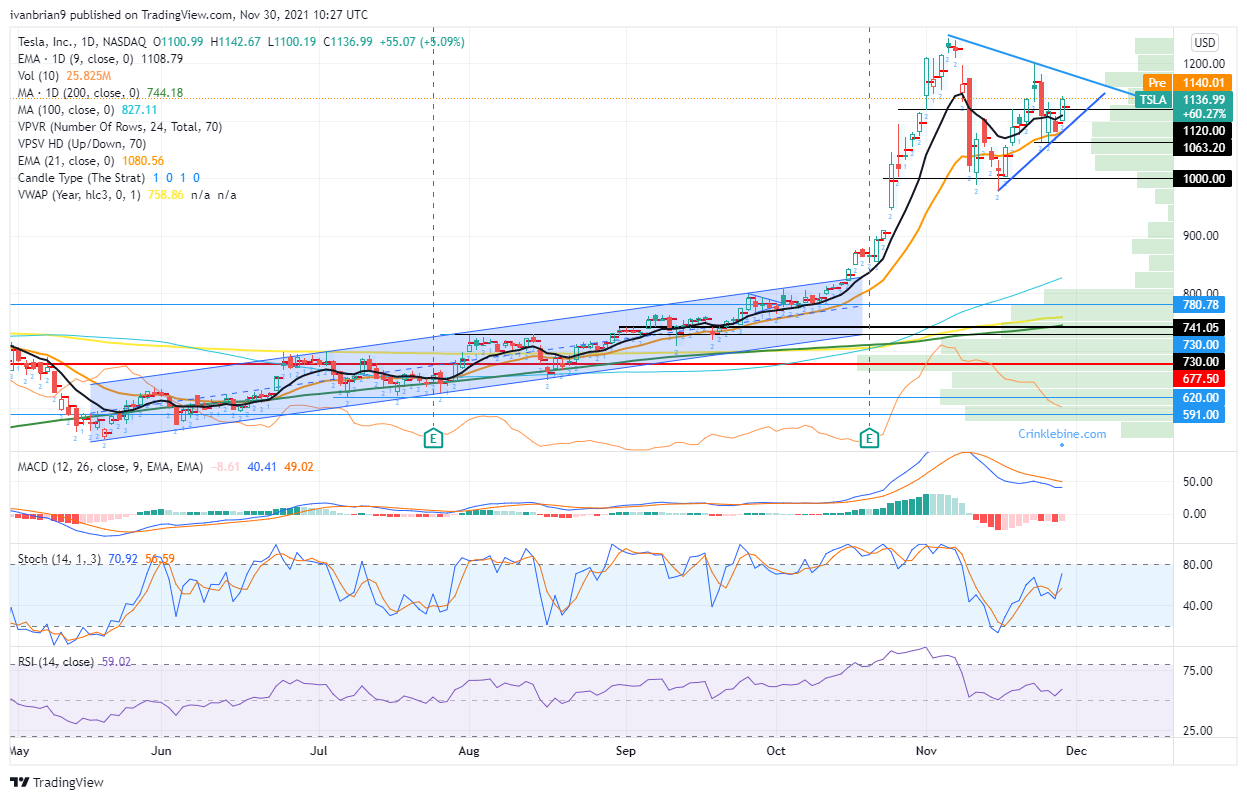
TSLA 1-day chart
Author

Ivan Brian
FXStreet
Ivan Brian started his career with AIB Bank in corporate finance and then worked for seven years at Baxter. He started as a macro analyst before becoming Head of Research and then CFO.


