|

TSLA managed to reach another blue box buying area

In this technical blog, we will look at the past performance of the 4-hour Elliott Wave Charts of Tesla ticker symbol: TSLA. We presented to members at the elliottwave-forecast. In which, the rally from 22 April 2024 low ended in an impulse structure. But showing a higher high sequence within the cycle from January 2023 low supports more upside. Therefore, we advised members not to sell the stock & buy the dips in 3, 7, or 11 swings at the blue box areas. We will explain the structure & forecast below:

TSLA four-hour Elliott Wave chart from 2.09.2025

Chart

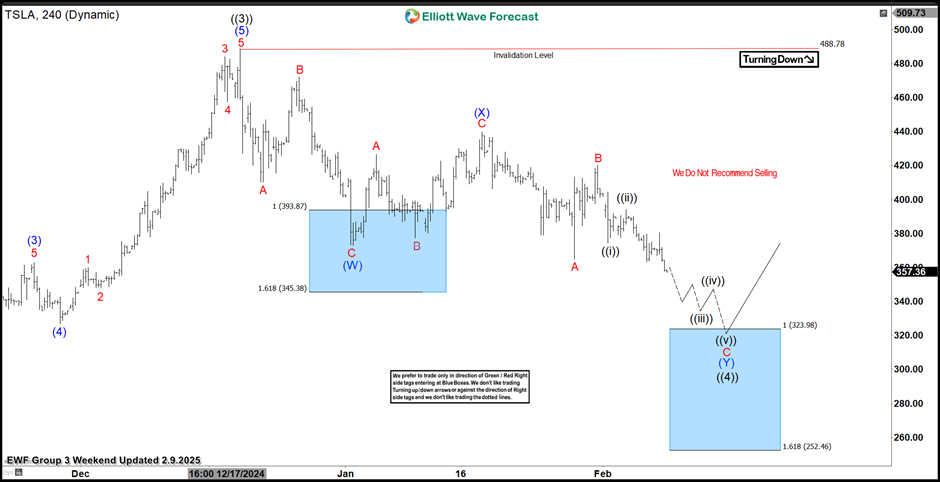
Here’s the 4-hour Elliott wave chart from the 2.09.2025 weekend update. In which, the cycle from the 4.22.2024 low ended in wave ((3)) at $488.54 high. Down from there, the stock made a pullback in wave ((4)) to correct that cycle. The internals of that pullback unfolded as Elliott wave double three structure where wave (W) ended at $373.04 low. Wave (X) bounce ended at $439.74 high and wave (Y) managed to reach the blue box area at $323.98- $252.46. From there, buyers were expected to appear looking for the next leg higher or for a 3 wave bounce minimum.

TSLA latest four-hour Elliott Wave chart from 2.16.2025

Chart

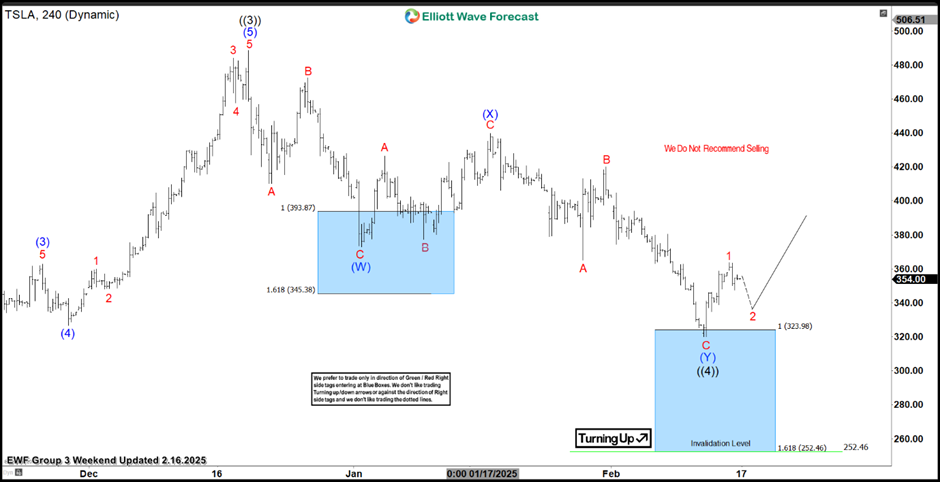
This is the latest 4-hour Elliott wave Chart from the 2.16.2025 weekend update. In which the stock is showing a reaction higher taking place, right after ending the double correction within the blue box area. However the bounce needs to react higher minimum towards $380.19 level to allow longs to get into a risk-free position. Later on, it would need to see a break above $488.54 high to confirm the next extension higher & avoid deeper pullback.

Author

Elliott Wave Forecast Team

Elliott Wave Forecast Team

ElliottWave-Forecast.com

More from Elliott Wave Forecast Team
Share:

Markets move fast. We move first.

Orange Juice Newsletter brings you expert driven insights - not headlines. Every day on your inbox.

By subscribing you agree to our Terms and conditions.

Editor's Picks

EUR/USD holds around 1.1750 after weak German and EU PMI data

EUR/USD maintains its range trade at around 1.1750 in European trading on Tuesday. Weaker-than-expected December PMI data from Germany and the Eurozone make it difficult for the Euro to find demand, while investors refrain from taking large USD positions ahead of key employment data.

GBP/USD remains below 1.3400 after mixed UK labor data

GBP/USD is trading around a flat line below 1.3400 in the European session on Tuesday. The UK ILO Unemployment Rate rose to 5.1% in the quarter to October, meeting expectations, while the pay growth cooled down sligthly in the same period, doing little to affect the Pound Sterling.

Gold retreats from seven week highs on profit-taking; all eyes on US NFP release

Gold price loses momentum below $4,300 during the early European trading hours on Tuesday, pressured by some profit-taking and weak long liquidation from the shorter-term futures traders. Furthermore, optimism around Ukraine peace talks could weigh on the safe-haven asset like Gold.

Sui Price Forecast: Sui slips below $1.50 as network demand and risk appetite wane

Sui remains under intense bearish pressure, extending losses by 1% at press time on Tuesday for the third straight day.

NFP preview: Complex data release will determine if Fed was right to cut rates

The long wait is over, and the Bureau of Labor Statistics in the US will release nonfarm payrolls reports for both November and October at 1330 GMT on Tuesday. The overall NFP figure for October is expected to be -10k, however, it is expected to be influenced by a massive 130k drop in federal department workers. 

BNB Price Forecast: BNB slips below $855 as bearish on-chain signals and momentum indicators turn negative

BNB, formerly known as Binance Coin, continues to trade down around $855 at the time of writing on Tuesday, after a slight decline the previous day. Bearish sentiment further strengthens as BNB’s on-chain and derivatives data show rising retail activity.