|

Travelers (TRV) is showing an incomplete bullish sequence

The Travelers Companies, Inc., TRV, is an American insurance company. It is the second-largest writer of U.S. commercial property casualty insurance, and the sixth-largest writer of U.S. personal insurance through independent agents.

Weekly TRV chart July 2023

Chart

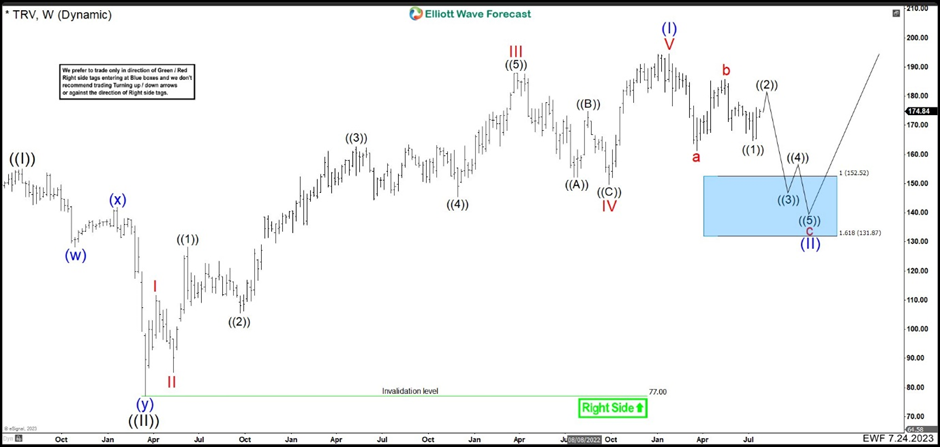
One year ago, we wrote that TRV ended a great super cycle in the year of 2019 reaching a peak at $154.86 which we call the wave ((I)). Then the market made a quick and strong correction driven by the COVID19 pandemic in 2020. The company lost 50% of its value reaching $76.99 per share in March. This culminated wave ((II)) and we are currently building wave ((III)). Wave (I) of ((III)) ended at $194.51 in January 2023 building an impulse and it has been correcting in wave (II) of ((III)) ever since. We expected to continue the rally in wave (III) of ((III)) after reaching 152.52 – 131.87 blue box area. (If you want to learn more about Elliott Wave Theory, please follow these links: Elliott Wave Education and Elliott Wave Theory) 

Weekly TRV chart July 2024

Chart

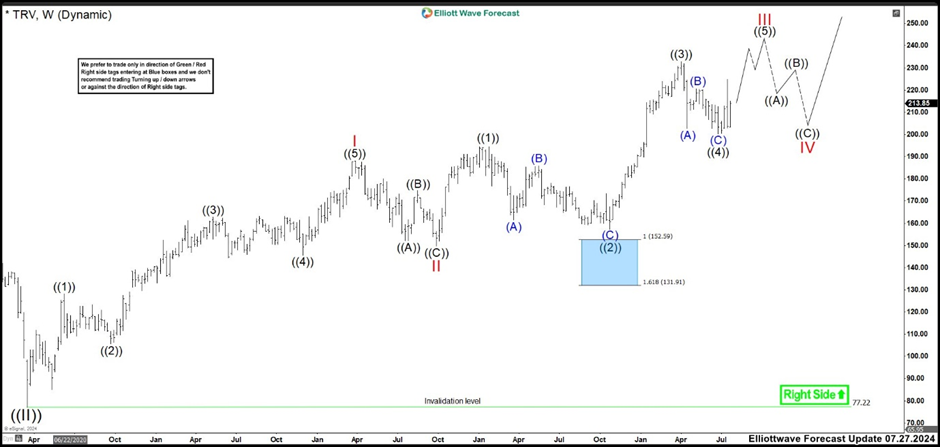
Currently, we can see the rally as expected, but missing the blue box for 5 dollars. Also, we adjusted the count in TRV weekly chart. We are still trading in wave ((III)), but with the new data, the stock is still in wave (I) of ((III)). Therefore, wave I higher ended at 187.98 and pullback as wave II finished at 149.65 low. The price rally again breaking wave I high suggesting that wave III of (I) had started. Then, wave ((1)) of III ended at 194.51 and the correction that we are expecting to enter the market ended at 157.33 low as wave ((2)). From here, we can see a strong momentum to the upside ending wave ((3)) of III at 232.75 high. Wave ((4)) of III built a zigzag correction ended at 200.21 low.

Now, we are looking one more push to the upside to complete wave ((5)) of III and wave III of (I) before starting a retracement in wave IV of (I). The correction should retest wave ((4)) low and then rally in wave V of (I). The possible area to end wave ((5)) comes in 240.74 – 253.27 where we should see a reaction lower to think that the cycle is ended.

Author

Elliott Wave Forecast Team

Elliott Wave Forecast Team

ElliottWave-Forecast.com

More from Elliott Wave Forecast Team
Share:

Markets move fast. We move first.

Orange Juice Newsletter brings you expert driven insights - not headlines. Every day on your inbox.

By subscribing you agree to our Terms and conditions.

Editor's Picks

EUR/USD clings to small gains near 1.1750

Following a short-lasting correction in the early European session, EUR/USD regains its traction and clings to moderate gains at around 1.1750 on Monday. Nevertheless, the pair's volatility remains low, with investors awaiting this weeks key data releases from the US and the ECB policy announcements.

GBP/USD edges higher toward 1.3400 ahead of US data and BoE

GBP/USD reverses its direction and advances toward 1.3400 following a drop to the 1.3350 area earlier in the day. The US Dollar struggles to gather recovery momentum as markets await Tuesday's Nonfarm Payrolls data, while the Pound Sterling holds steady ahead of the BoE policy announcements later in the week.

Gold stuck around $4,300 as markets turn cautious

Gold loses its bullish momentum and retreats below $4,350 after testing this level earlier on Monday. XAU/USD, however, stays in positive territory as the US Dollar remains on the back foot on growing expectations for a dovish Fed policy outlook next year.

Solana consolidates as spot ETF inflows near $1 billion signal institutional dip-buying

Solana price hovers above $131 at the time of writing on Monday, nearing the upper boundary of a falling wedge pattern, awaiting a decisive breakout. On the institutional side, demand for spot Solana Exchange-Traded Funds remained firm, pushing total assets under management to nearly $1 billion since launch. 

Big week ends with big doubts

The S&P 500 continued to push higher yesterday as the US 2-year yield wavered around the 3.50% mark following a Federal Reserve (Fed) rate cut earlier this week that was ultimately perceived as not that hawkish after all. The cut is especially boosting the non-tech pockets of the market.

Solana Price Forecast: SOL consolidates as spot ETF inflows near $1 billion signal institutional dip-buying

Solana (SOL) price hovers above $131 at the time of writing on Monday, nearing the upper boundary of a falling wedge pattern, awaiting a decisive breakout.