TJX Companies (TJX): Elliott Wave points to more upside before pullback

TJX Companies, Inc., (TJX) operates as an off-price apparel & home fashions retailer in Unites States, Canada, Europe & Australia. It operates through four segments: Marmaxx, HomeGoods, TJX Canada & TJX International. It sells products through stores & e-commerce sites. It comes under Consumer Cyclical sector & trades as “TJX” ticker at NYSE.
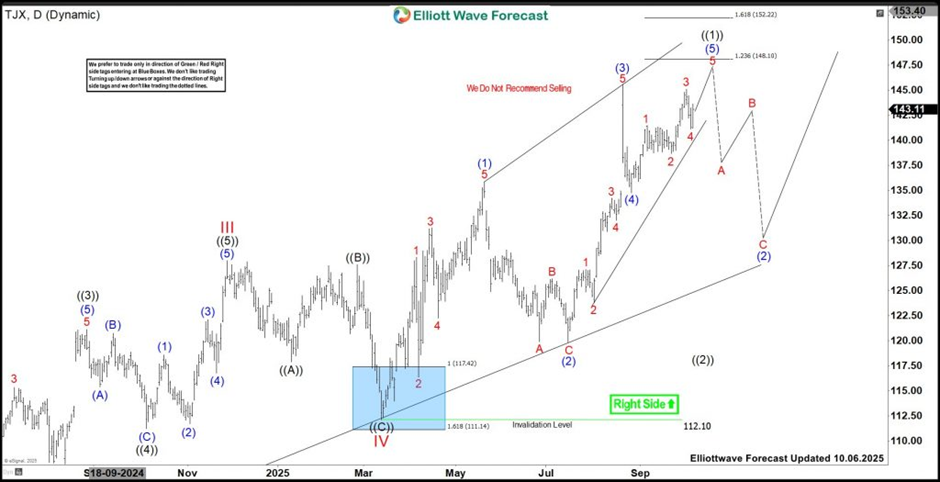
TJX rallied to new high as expected in impulse V proposed in last article against 3.13.2025 low. Short term, it expects rally towards $148.10 to finish proposed diagonal in ((1)) of V, while above 8.26.2025 low. We like to buy the next correction in 3, 7 or 11 swings in ((2)) later against March-2025 low.
TJX – Elliott Wave latest daily view
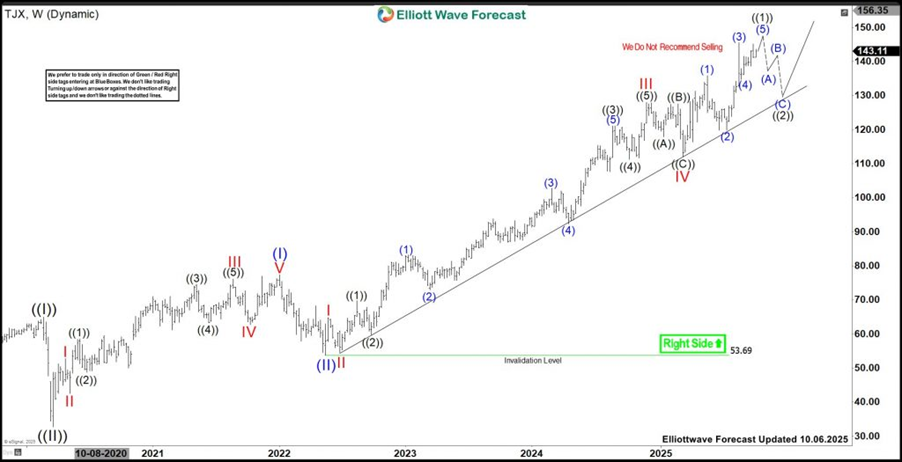
In Weekly, it started ((III)) bullish sequence from March-2020 low of $32.72. It placed (I) impulse at $77.35 high & (II) at $53.69 low as 0.5 Fibonacci retracement in May-2022 low. Above there, it favors upside in (III) & expect at least one or few more highs above 3.13.2025 low. Chasing at this level should be cautious. Within (III), it placed I at $64.84 high, II at $54.55 low, III at $128 high as extended wave, IV at $112.10 low & favors rally in V. Within III, it placed at ((1)) at $69.77 high, ((2)) at $59.78 low, ((3)) at $121.13 high, ((4)) at $111.22 low & ((5)) at $128 high. It ended IV in zigzag correction. Above IV low of $112.10, It favors rally in ((1)) of V & expect one more push higher against 8.26.2025 low before correcting in ((2)).
TJX – Elliott Wave latest weekly view
Within ((1)), it placed (1) at $1385.85 high as diagonal, (2) at $119.84 low, (3) at $145.58 high, (4) at $134.75 low & favors upside in (5). Because of (4) overlaps with (1), it either extending in diagonal to finish ((1)) above $145.58 before correcting in ((2)). Alternatively, it can be nesting in (3) of ((3)), while placed ((2)) at 7.16.2025 low, if rally erasing momentum divergence. In either the case, we like to buy the next pullback in 3, 7 or 11 swings pullback, while holding price trendline & March-2025 low. Even it can be (4) pullback, if breaks below 8.26.2025 low, without breaking above 8.20.2025 high to correct 7.16.2025 low.
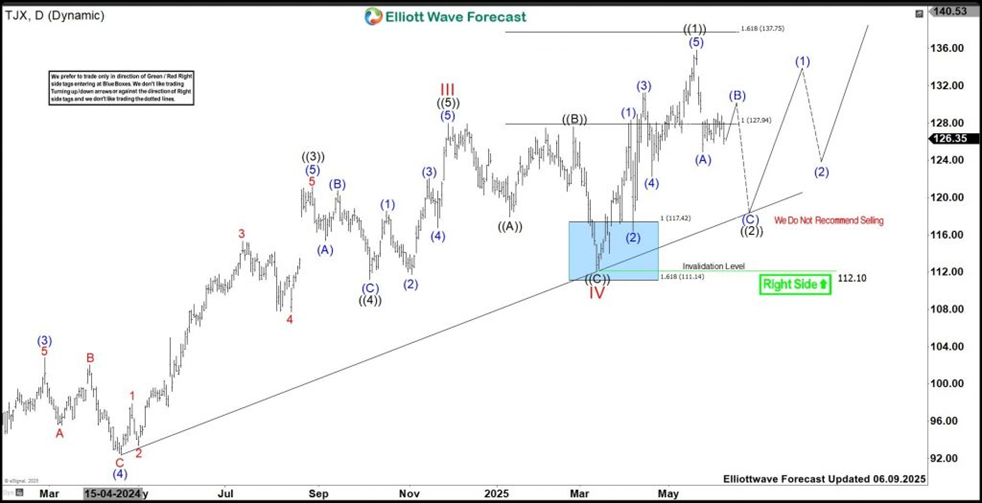
TJX – Elliott Wave view from 6.09.2025
Author

Elliott Wave Forecast Team
ElliottWave-Forecast.com


