|

The VIX drops again and its about to test a massive level

  • The VIX is 6.18% lower on Thursday in another positive session for equities.
  • The price is testing the old consolidation high and could break back into the old range.

Fundamental backdrop

Once again investors and traders are choosing to focus on the positive news rather than the negative as the major US bourses all trade higher. Today the non-farm payroll data beat expectations of 3mln to print at 4.8mln, also the previous number was revised higher to 2.699mln from 2.509mln. Also, the unemployment rate fell to 11.1% from last months reading of 13.3%. 

Elsewhere on the positive side US Treasury Secretary Mnuchin said "a number of businesses will be hit hard and need additional money. He added that the "money in paycheck" protection program will be repurposed. On the other end of the scale, the case count in Florida has risen again by 6.4% above the 7 day average of 5.6%. Alabama also had its daily record increase since the pandemic began. It seems there is still a lot more pain to come in the US unfortunatly.
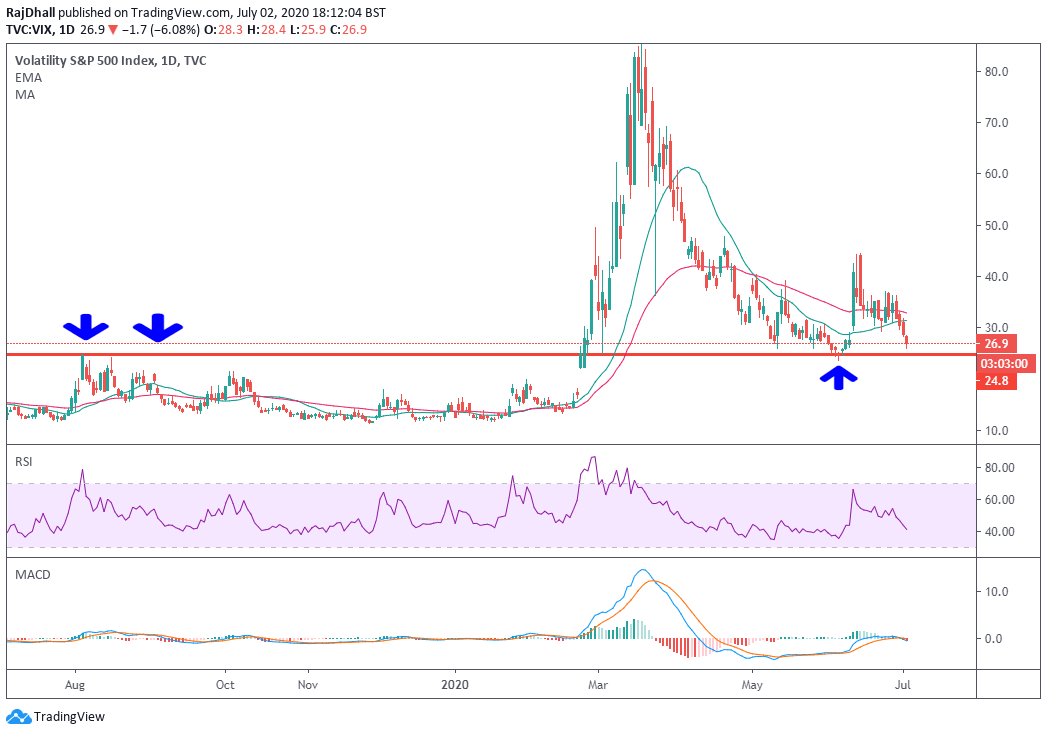
VIX daily chart

The chart below shows just how close the VIX is to breaking into the "normal" range. The consolidation top is at 24.8 and the VIX hit a low of 25.9 during Thursday's session. Looking at the technical indicators the MACD has moved back below the mid-line with the signal lines also following.  The Relative Strength Index is also dipping sharply and is below the 50 zone. Tomorrow US markets are closed due to Independence Day so we will probably have to wait till next week to see if the market can break the support.

VIX Daily chart

Author

Rajan Dhall, MSTA

Rajan Dhall is an experienced market analyst, who has been trading professionally since 2007 managing various funds producing exceptional returns.

More from Rajan Dhall, MSTA
Share:

Editor's Picks

EUR/USD recedes to daily lows near 1.1850

EUR/USD keeps its bearish momentum well in place, slipping back to the area of 1.1850 to hit daily lows on Monday. The pair’s continuation of the leg lower comes amid decent gains in the US Dollar in a context of scarce volatility and thin trade conditions due to the inactivity in the US markets.

GBP/USD resumes the downtrend, back to the low-1.3600s

GBP/USD rapidly leaves behind Friday’s decent advance, refocusing on the downside and retreating to the 1.3630 region at the beginning of the week. In the meantime, the British Pound is expected to remain under the microscope ahead of the release of the key UK labour market report on Tuesday.

Gold looks inconclusive around $5,000

Gold partially fades Friday’s strong recovery, orbiting around the key $5,000 region per troy ounce in a context of humble gains in the Greenback on Monday. Additing to the vacillating mood, trade conditions remain thin amid the observance of the Presidents Day holiday in the US.

Bitcoin consolidates as on-chain data show mixed signals

Bitcoin price has consolidated between $65,700 and $72,000 over the past nine days, with no clear directional bias. US-listed spot ETFs recorded a $359.91 million weekly outflow, marking the fourth consecutive week of withdrawals.

The week ahead: Key inflation readings and why the AI trade could be overdone

It is likely to be a quiet start to the week, with US markets closed on Monday for Presidents Day. European markets are higher across the board and gold is clinging to the $5,000 level after the tamer than expected CPI report in the US reduced haven flows to precious metals.

XRP steadies in narrow range as fund inflows, futures interest rise

Ripple is trading in a narrow range between $1.45 (immediate support) and $1.50 (resistance) at the time of writing on Monday. The remittance token extended its recovery last week, peaking at $1.67 on Sunday from the weekly open at $1.43.