The two levels of resistance coming up for Okta

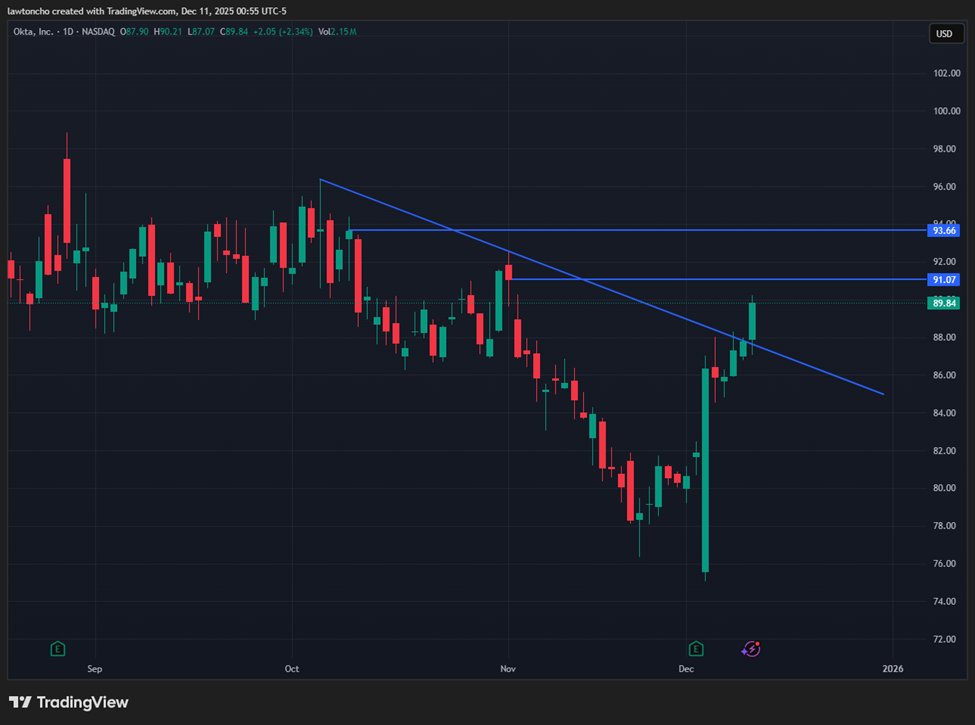
Okta put in a strong performance today, closing more than 2% higher than Monday’s finish, and that move caught my attention immediately. From a technical analysis standpoint, the stock is pushing through a downsloping trendline that has been containing price for a while. Any time I see that kind of shift in momentum, I start mapping out the levels that matter most to me, especially when I’m preparing for a potential pullback or reversal.
Before digging deeper into the setup, I want to share a bit of context for why I track Okta so closely. The company has long positioned itself as a key player in secure identity management, and because of that reputation, I’ve watched how traders tend to react around its major price swings. Over time, I’ve noticed that Okta often respects clean technical patterns and gap levels, which makes it a name I revisit when I’m looking for opportunities guided by both structure and sentiment. That familiarity is why I’m always ready with my levels ahead of the move rather than after it.
With today’s strength, there are two major resistance zones I’m keeping on my chart. The first level is the gap fill sitting near $91, which is the immediate area I’ll be watching should momentum continue upward. If price pushes through that region, my next level is the $93.66 gap fill zone, which I consider a secondary resistance level and a potential turning point for the stock. These are the two areas where I would personally look for shorting opportunities, assuming the price action confirms what I’m anticipating.
Even with a clear plan, trading never comes without uncertainty. That’s why I always emphasize proper risk management, especially when shorting into strength. Patience, discipline, and respect for the technicals are what keep me consistent, and Okta’s current setup is no exception. I’ll be watching closely to see how price behaves as it approaches these levels.
Author

Lawton Ho
Verified Investing
A marketing expert sharing his journey to mastering the charts.