The New Zealand Dollar extends its slide as the US Dollar hits a yearly high
- NZD/USD extends its slide under 0.5600, its lowest since November 2025, as the Dollar hits a yearly high.
- Sixth straight weekly loss on track, from just under 0.6000 in late August.
- RBNZ cash rate at 2.75%, up from 2.25% after its last cut in November 2025.

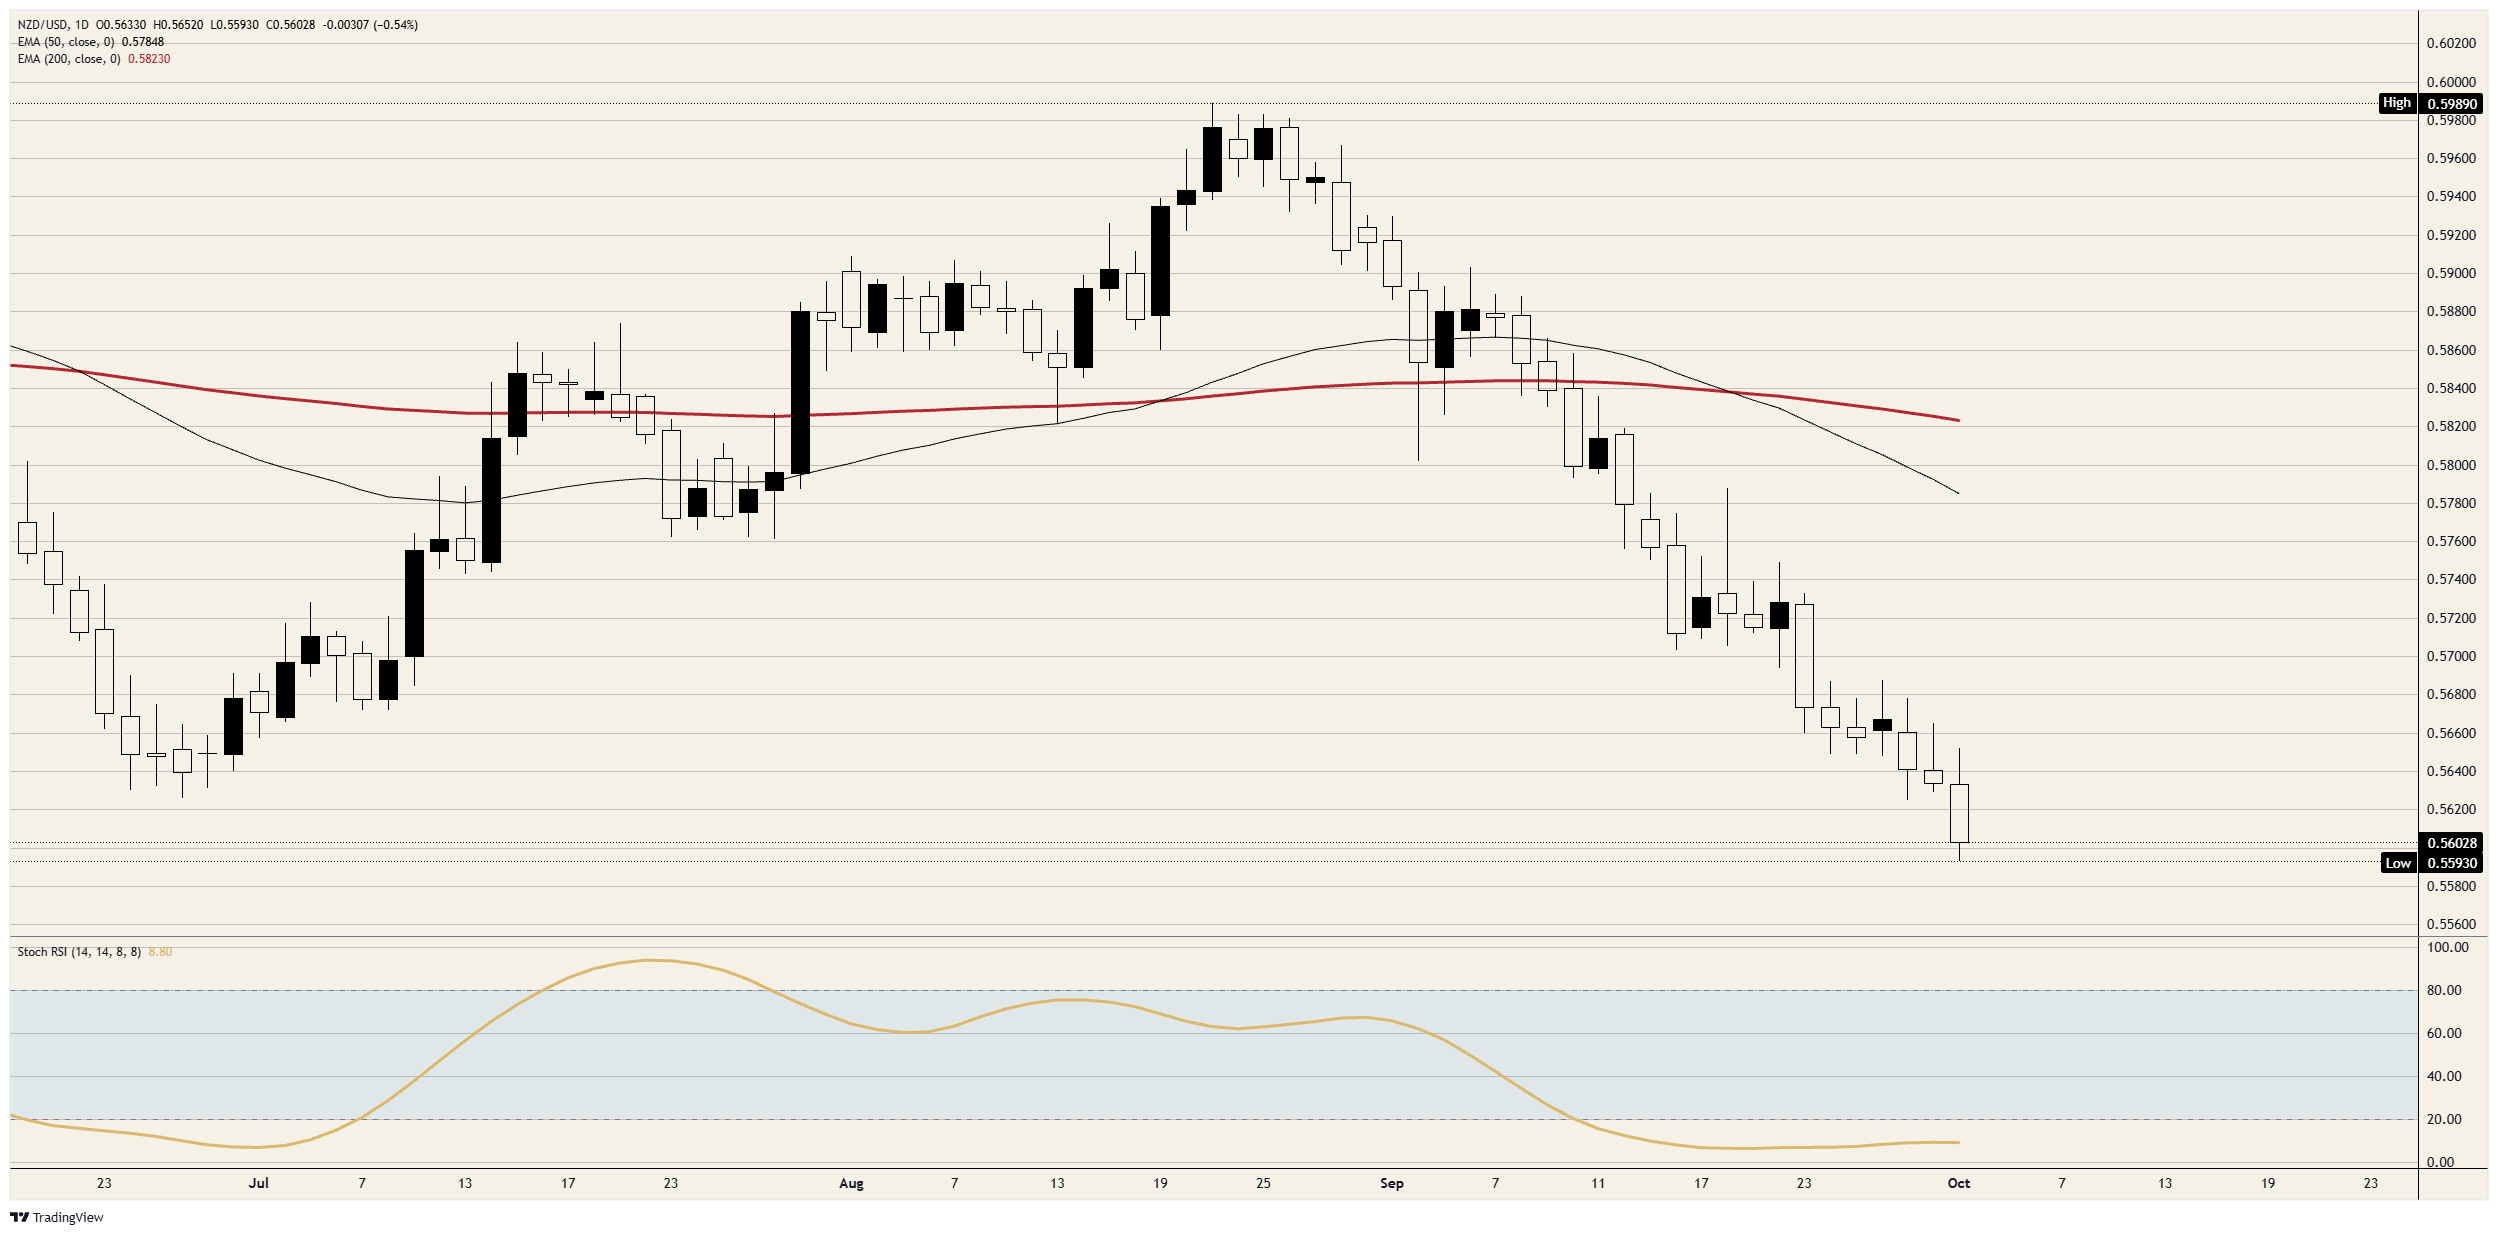
Five losing weeks in a row and most of a sixth have taken NZD/USD to its lowest since the Reserve Bank of New Zealand (RBNZ) last cut rates, in November 2025. The RBNZ has raised its rate twice since, to 2.75%, and traders have built up bets on a third hike on October 28. NZD/USD trades just above 0.5600 and is down for a third session running.
The Fed's range is back where it was in November 2025, and so is the Kiwi
The Fed's range is 3.75%-4.00% after its September 16 hike, the same as in November 2025. The RBNZ's Official Cash Rate (OCR) is a quarter-point above where it stood before its November 2025 cut. The gap between the two policy rates is narrower than the last time NZD/USD traded this low.
What has changed is longer-term US borrowing costs, with the 10-year Treasury yield at its highest since 2002 on Thursday. The RBNZ may yet hike a third time on October 28, and the two hikes before it have left the Kiwi where it started.
Soft US data hasn't been enough to lift the Kiwi
US payrolls on Friday at 12:30 GMT are the next scheduled test for NZD/USD, with 90K jobs forecast after August's 162K. New Zealand's next release is third-quarter business confidence from the New Zealand Institute of Economic Research (NZIER), due on Monday at 21:00 GMT and last at 8%. China, New Zealand's largest export market, is on holiday until October 7.
Softer US inflation figures on Wednesday didn't stop NZD/USD falling that day. The 90K payroll forecast already describes a slowing job market, so a weak count would be the expected result rather than news.
The New Zealand Dollar's levels and bias
Resistance: 0.5650 kept Tuesday's and Wednesday's daily closes below it, near where the week opened, and every session since September 23 has peaked below 0.5700.
Support: The break under 0.5600 leaves Thursday's low just beneath it as the first marker, then 0.5550 and 0.5500.
Bias: The tape stays offered below 0.5650 on a closing basis, with 0.5550 the first objective and 0.5500 the second. The daily Stochastic Relative Strength Index (Stoch RSI) is near 9, roughly where it has been since mid-September, so the slide is old without having turned. A daily close above 0.5700 cancels the short.
NZD/USD daily chart
New Zealand Dollar FAQs
The New Zealand Dollar (NZD), also known as the Kiwi, is a well-known traded currency among investors. Its value is broadly determined by the health of the New Zealand economy and the country’s central bank policy. Still, there are some unique particularities that also can make NZD move. The performance of the Chinese economy tends to move the Kiwi because China is New Zealand’s biggest trading partner. Bad news for the Chinese economy likely means less New Zealand exports to the country, hitting the economy and thus its currency. Another factor moving NZD is dairy prices as the dairy industry is New Zealand’s main export. High dairy prices boost export income, contributing positively to the economy and thus to the NZD.
The Reserve Bank of New Zealand (RBNZ) aims to achieve and maintain an inflation rate between 1% and 3% over the medium term, with a focus to keep it near the 2% mid-point. To this end, the bank sets an appropriate level of interest rates. When inflation is too high, the RBNZ will increase interest rates to cool the economy, but the move will also make bond yields higher, increasing investors’ appeal to invest in the country and thus boosting NZD. On the contrary, lower interest rates tend to weaken NZD. The so-called rate differential, or how rates in New Zealand are or are expected to be compared to the ones set by the US Federal Reserve, can also play a key role in moving the NZD/USD pair.
Macroeconomic data releases in New Zealand are key to assess the state of the economy and can impact the New Zealand Dollar’s (NZD) valuation. A strong economy, based on high economic growth, low unemployment and high confidence is good for NZD. High economic growth attracts foreign investment and may encourage the Reserve Bank of New Zealand to increase interest rates, if this economic strength comes together with elevated inflation. Conversely, if economic data is weak, NZD is likely to depreciate.
The New Zealand Dollar (NZD) tends to strengthen during risk-on periods, or when investors perceive that broader market risks are low and are optimistic about growth. This tends to lead to a more favorable outlook for commodities and so-called ‘commodity currencies’ such as the Kiwi. Conversely, NZD tends to weaken at times of market turbulence or economic uncertainty as investors tend to sell higher-risk assets and flee to the more-stable safe havens.
Author

Joshua Gibson
FXStreet
Joshua joins the FXStreet team as an Economics and Finance double major from Vancouver Island University with twelve years' experience as an independent trader focusing on technical analysis.