Nike misses revenue consensus, shares down 4% to new 12-year low
- Nike shares dip to 12-year lows as share price breaks below $33.
- Management expects revenue to decline between 7% and 9% this fiscal year.
- Greater China revenue falls 22%, Converse revenue down 28%.
- Monthly chart points to $23 as next area of support for NKE.

Well, folks, the brand known to "just do it" just did it again. That's right. Nike (NKE) shat the bed in fiscal Q1 2027.
The footwear and athletic company posted revenue of $11.21 billion for the quarter ending in August, missing the consensus by $110 million and showing that demand is still faltering after several miserable years. Revenue fell over 4% YoY.
Nike beat the earnings estimate by 4 cents, reporting $0.48 in GAAP earnings per share (EPS). But that did little to impress the market as management's outlook called for a revenue decline in the full fiscal year of between 7% and 9%. The executive team now projects full-year revenue of $42.7 billion compared with the prior consensus of $45.3 billion.
"We have more work to do in Nike Sportswear, Jordan Brand and Greater China, and we're taking deliberate actions to strengthen those businesses the right way for the long term," said CEO Elliot Hill in a statement.
Hill mentions China, because that was the worst of it in Q1. The Greater China region saw revenue decline by 22%, while North America revenue stemmed the tide by gaining 2%.
However, Converse revenue also fell a surprising 28%, and the Nike Brand segment saw a 4% revenue decline.
Nike Direct revenue declined 8%, and the full Digital segment saw a decline of 13% YoY.
Nike management expects a $1.15 to $1.35 in diluted earnings per share for fiscal 2027.
Nike stock charts
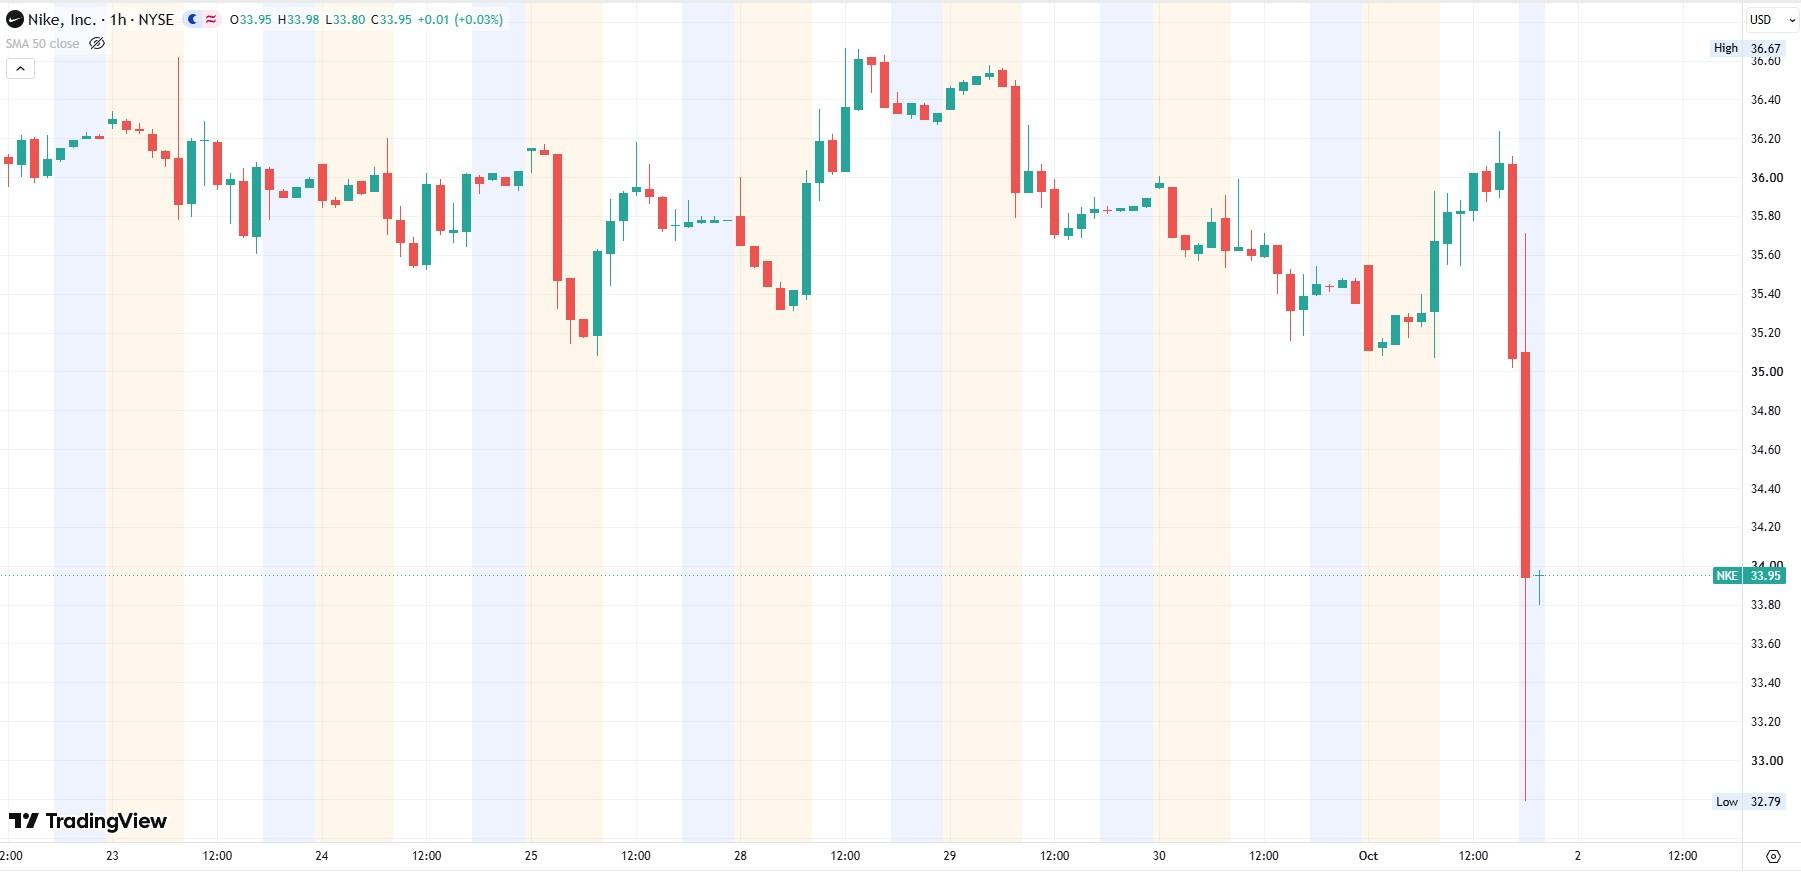
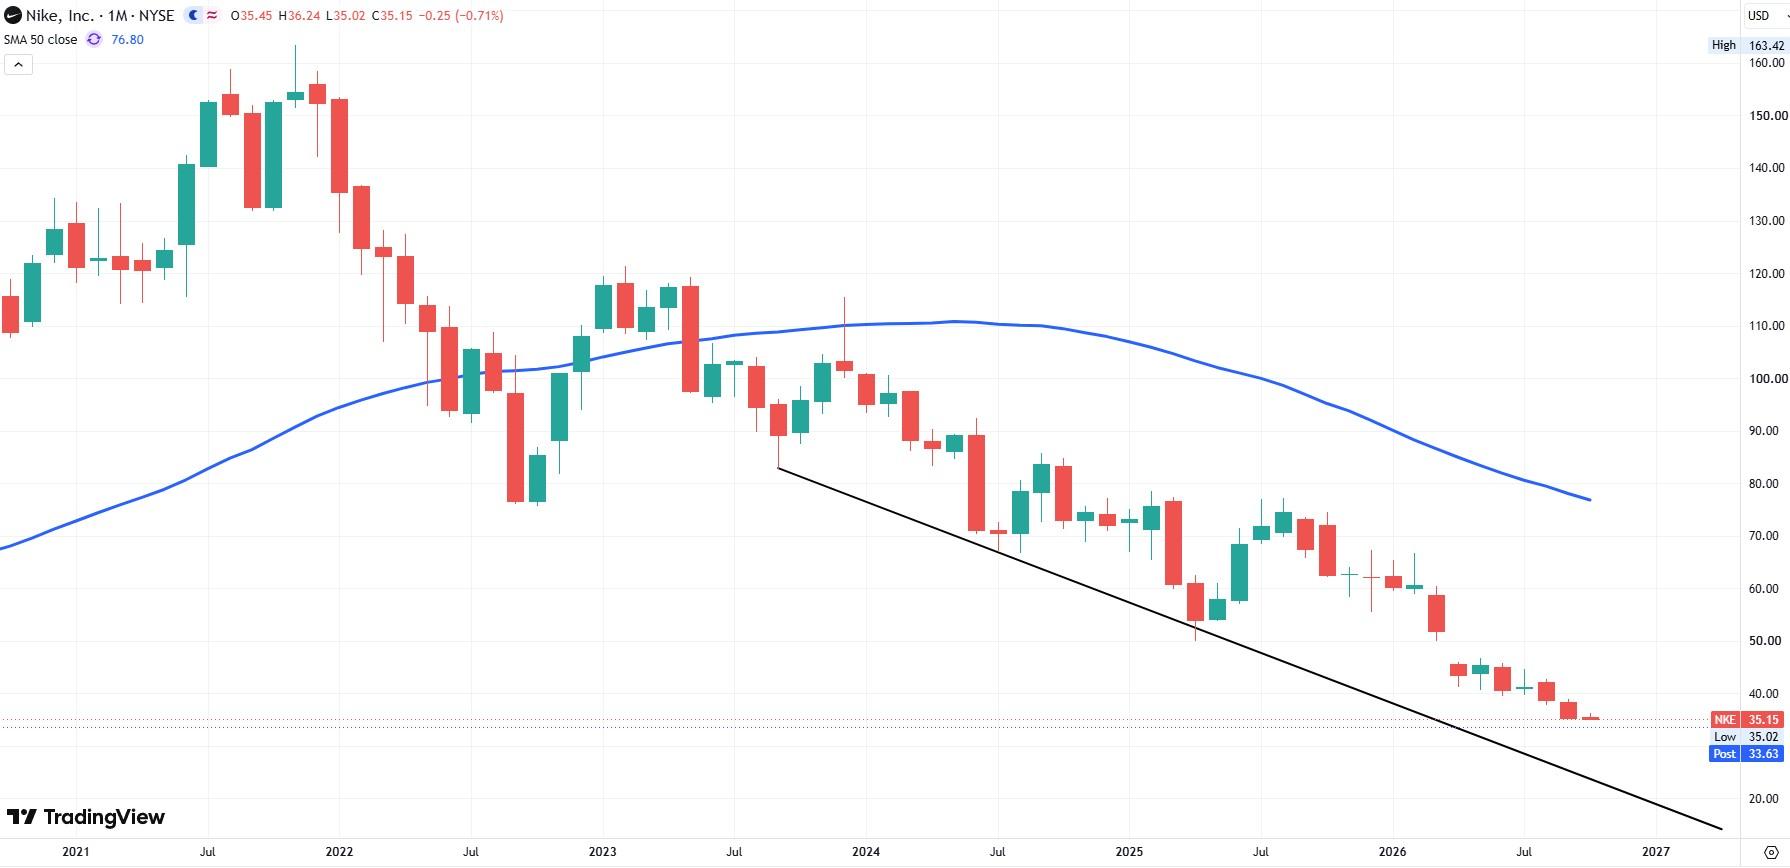
Nike's 1-hour chart showed that the Nike share price fell afterhours from a regular session close at $35.15 to as low as $32.79 before stabilizing closer to $34.00. The sell-off pushes Nike's share price back to 2014 levels and nearly 80% off the company's November 2021 high above $163.00.
Just when many had predicted that Nike was nearing a bottom, the monthly chart shows that the lowest price in 12 years could still fall further. The bottom trendline that connects earlier sell-offs in 2023, 2024 and 2025 points to NKE losing another 30% percent of its share price. That is, if bears attempt to retest that trendline in the vicinity of $23.00.
Author
Clay Webster
FXStreet
Clay Webster grew up in the US outside Buffalo, New York and Lancaster, Pennsylvania. He began investing after college following the 2008 financial crisis.