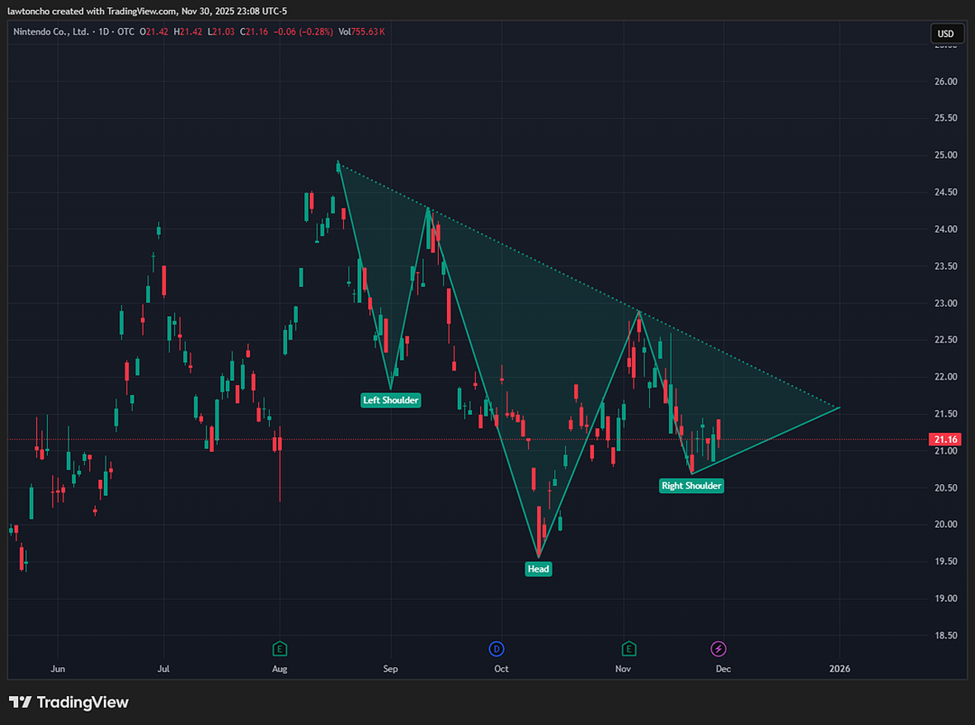
The inverse head and shoulders pattern on Nintendo’s price chart

When I look at Nintendo (NTDOY) right now, what immediately stands out to me is how much the stock has pulled back since the 6th of November. We’re talking about a move of roughly 8% off those levels. It’s always interesting to me when a company with a market cap around $99 billion trades over the counter rather than on one of the major U.S. exchanges. Even without a primary listing here, I still like keeping a close eye on the technicals when I’m looking for clean setups or potential trend shifts.
Before diving into the current chart pattern, I think it’s helpful to acknowledge some background on Nintendo itself. As someone who has followed markets for a long time, I’ve always found it notable how certain companies consistently stay relevant across decades. Nintendo is one of those companies. The brand’s longevity and its ability to remain present in people’s lives make it a name I pay attention to, especially when I’m reviewing long-term technicals or watching for moments where sentiment and structure might align.
On the chart, what I’m seeing now is an inverse head and shoulders pattern that has been forming since the 18th of August. This is one of the classical reversal patterns I like to track because, when it confirms, it often signals a meaningful shift in momentum. Based on the measured move of this structure, the projected upside would be a move of more than 18% from the neckline. That kind of potential doesn’t guarantee anything, but it definitely puts the chart on my radar.
In terms of how I would personally approach trading this setup, there are two main ways I look at it. Traders can either enter on a confirmed break above the neckline—waiting for that clean push through resistance—or they can wait for a retrace back into the neckline after the breakout. Both approaches have their place depending on someone’s style and comfort level. What matters most, at least in my view, is staying disciplined with risk management. No matter how clean a pattern looks, I always make sure my position sizing and stop placement reflect the risk I’m willing to take on the trade.
At the end of the day, the inverse head and shoulders forming on Nintendo is something I’m watching closely. Whether someone ends up taking the breakout or waiting for a pullback entry, the structure itself is clear, and the technicals offer a roadmap for potential opportunity.
Author

Lawton Ho
Verified Investing
A marketing expert sharing his journey to mastering the charts.


