|

The Home Depot (HD) Elliott Wave technical analysis [Video]

HD Elliott Wave technical analysis

  • Function: Trend.

  • Mode: Motive.

  • Structure: Impulsive.

  • Position: Wave 3 of (3).

  • Direction: Upside into Wave 3.

Details:

  • Expecting acceleration higher into Wave 3 of (3) to confirm the presence of a third-of-a-third wave.

  • As long as pullbacks remain corrective three-wave moves, we can anticipate further upside momentum.

Home

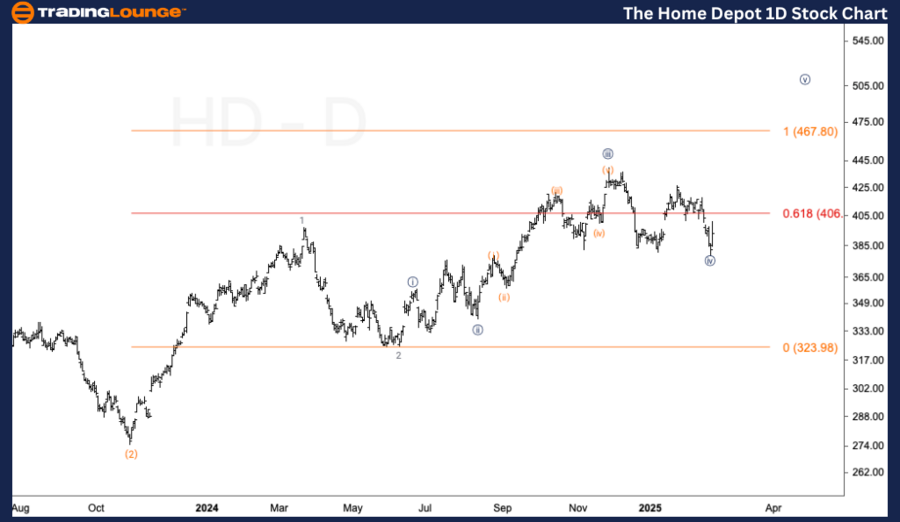
HD daily chart analysis

HD Elliott Wave technical analysis

  • Function: Trend.

  • Mode: Motive.

  • Structure: Impulsive.

  • Position: Wave {iv}.

  • Direction: Bottom in Wave {iv}.

Details:

  • Looking for a bottom in Wave {iv}, which could already be in place if the correction unfolded as a complex structure.

  • Alternative scenario: The market could still be forming Wave iv of (c) of {iv}, indicating a possibility of further downside before resuming the uptrend.

Chart

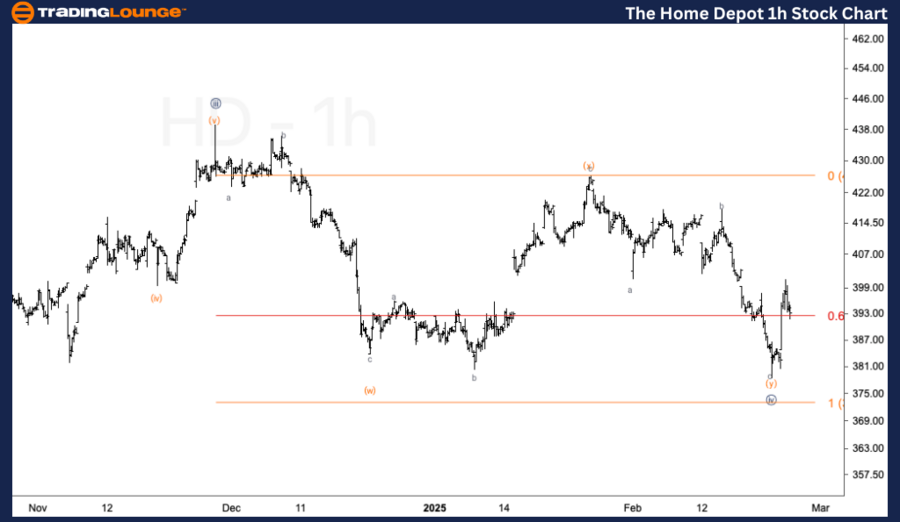
HD one-hour chart analysis

Summary of HD analysis

The Elliott Wave analysis for The Home Depot (HD) suggests that the stock is currently in an impulsive structure within Wave 3 of (3).

  • Daily Chart: We anticipate further upside momentum, provided that corrections remain three-wave pullbacks.

  • 1-Hour Chart: We are closely monitoring Wave {iv}'s bottom formation. If confirmed, the uptrend may resume soon.

This analysis provides insights into HD’s trend structure based on Elliott Wave Theory, helping traders and investors align their strategies with the stock's projected movements.

The Home Depot (HD) Elliott Wave technical analysis [Video]

Author

Peter Mathers

Peter Mathers

TradingLounge

Peter Mathers started actively trading in 1982. He began his career at Hoei and Shoin, a Japanese futures trading company.

More from Peter Mathers
Share:

Editor's Picks

EUR/USD deflates to fresh lows, targets 1.1600

The selling pressure on EUR/USD now gathers extra pace, prompting the pair to hit fresh multi-week lows in the 1.1625-1.1620 band on Friday. The continuation of the downward bias comes in response to further gains in the US Dollar as market participants continue to assess the mixed release of US Nonfarm Payrolls in December.

GBP/USD breaks below 1.3400, challenges the 200-day SMA

GBP/USD remains under heavy fire and retreats for the fourth consecutive day on Friday. Indeed, Cable suffers the strong performance of the Greenback, intensified post-mixed NFP, and trades at shouting distance from its critical 200-day SMA near 1.3380.

Gold flirts with yearly tops around $4,500

Gold keeps its positive bias on Friday, adding to Thursday’s advance and challenging yearly highs in the $4,500 region per troy ounce. The risk-off sentiment favours the yellow metal despite the firmer tone in the Greenback and rising US Treasury yields.

Crypto Today: Bitcoin, Ethereum, XRP risk further decline as market fear persists amid slowing demand

Bitcoin holds $90,000 but stays below the 50-day EMA as institutional demand wanes. Ethereum steadies above $3,000 but remains structurally weak due to ETF outflows. XRP ETFs resume inflows, but the price struggles to gain ground above key support.

Week ahead – US CPI might challenge the geopolitics-boosted Dollar

Geopolitics may try to steal the limelight from US data. A possible US Supreme Court ruling on tariffs could dictate market movements. A crammed data calendar next week, US CPI comes on Tuesday; Fedspeak to intensify.

XRP trades under pressure amid weak retail demand

XRP presses down on the 50-day EMA support as risk-averse sentiment spreads despite a positive start to 2026. XRP faces declining retail demand, as reflected in futures Open Interest, which has fallen to $4.15 billion.