The bottoming process starts with this [Video]
![The bottoming process starts with this [Video]](https://editorial.fxsstatic.com/images/i/SP500-bullysh-withoutbull-02_XtraLarge.jpg)
Watch the video below to discover:
-
How the market breadth behaved during these 6 market crashes and how to anticipate a market bottom.
-
What traders and investors should do during this extremely volatile period.
-
The magic MA line that supports the long-term trend in the past 15 years.
-
The bull trap you need to watch out for WHEN the bottoming process is unfolding (price action is the ultimate confirmation).
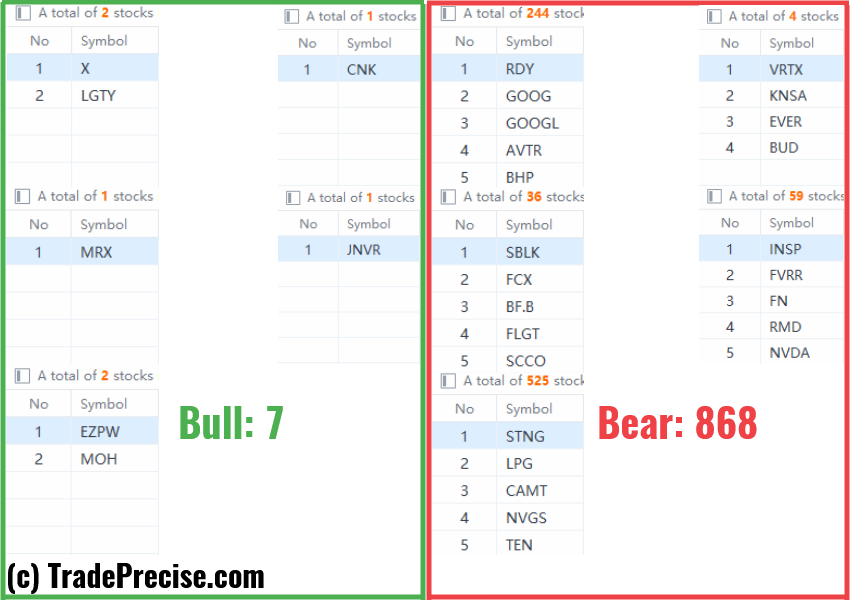
Market environment
The bullish vs. bearish setup is 7 to 868 from the screenshot of my stock screener below.
Two stocks buck the trend during market crash
MRX, EZPW were discussed during the live session before the market open (BMO).
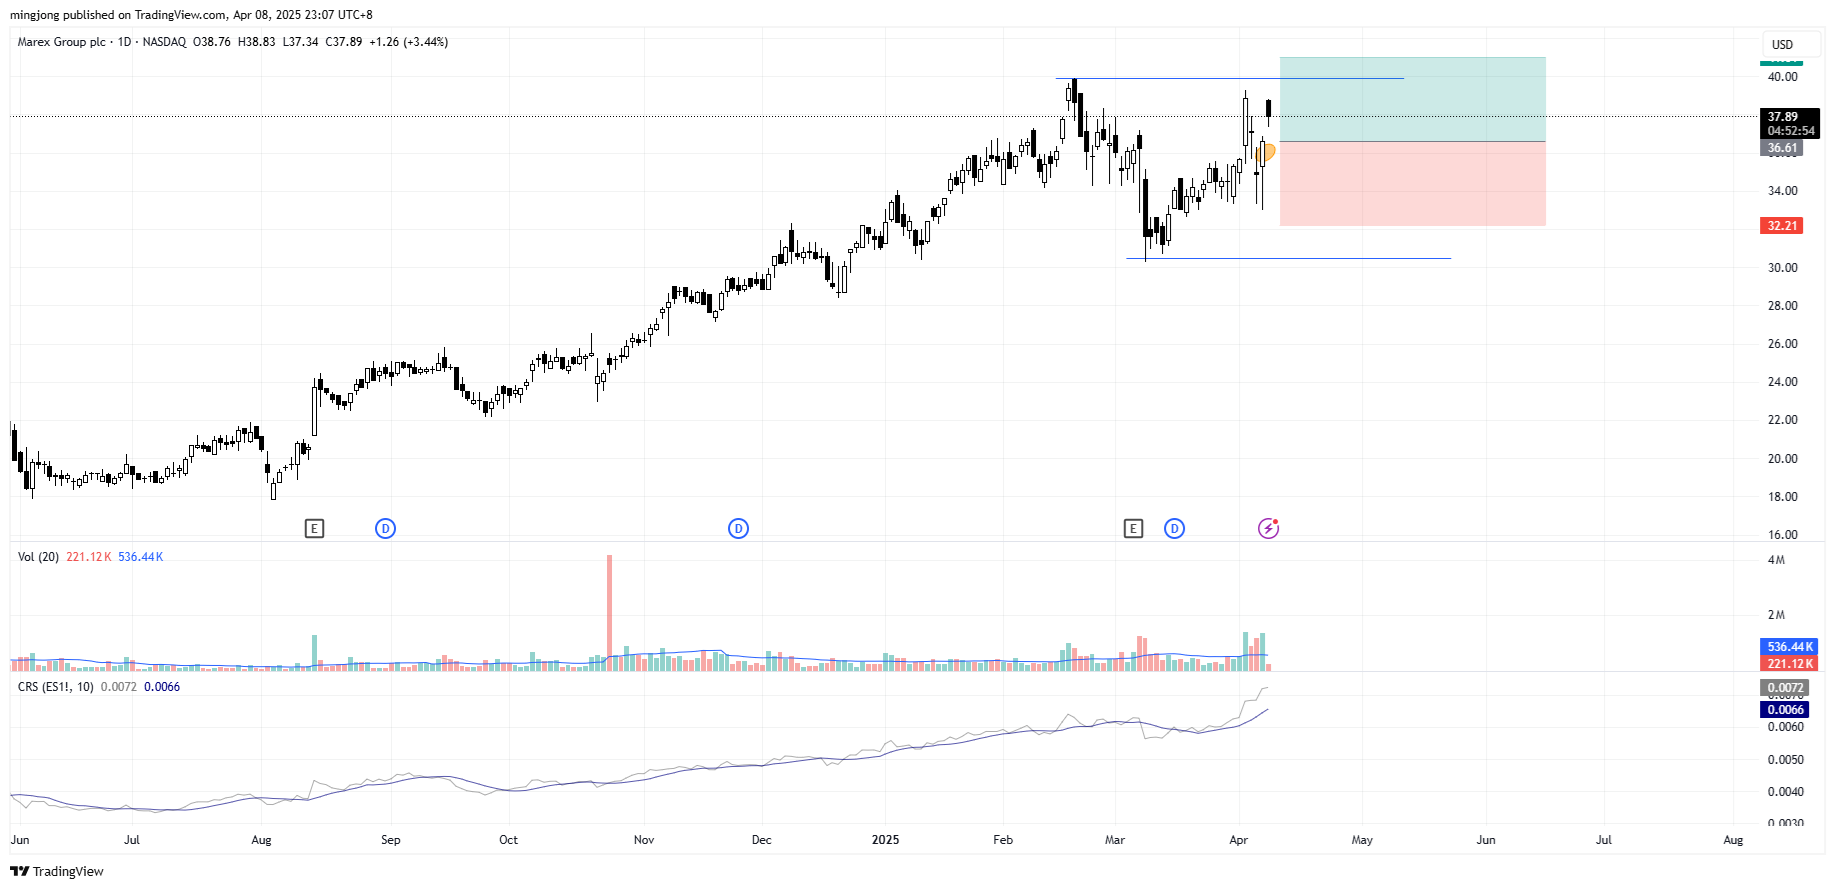
Marex Group (MRX)
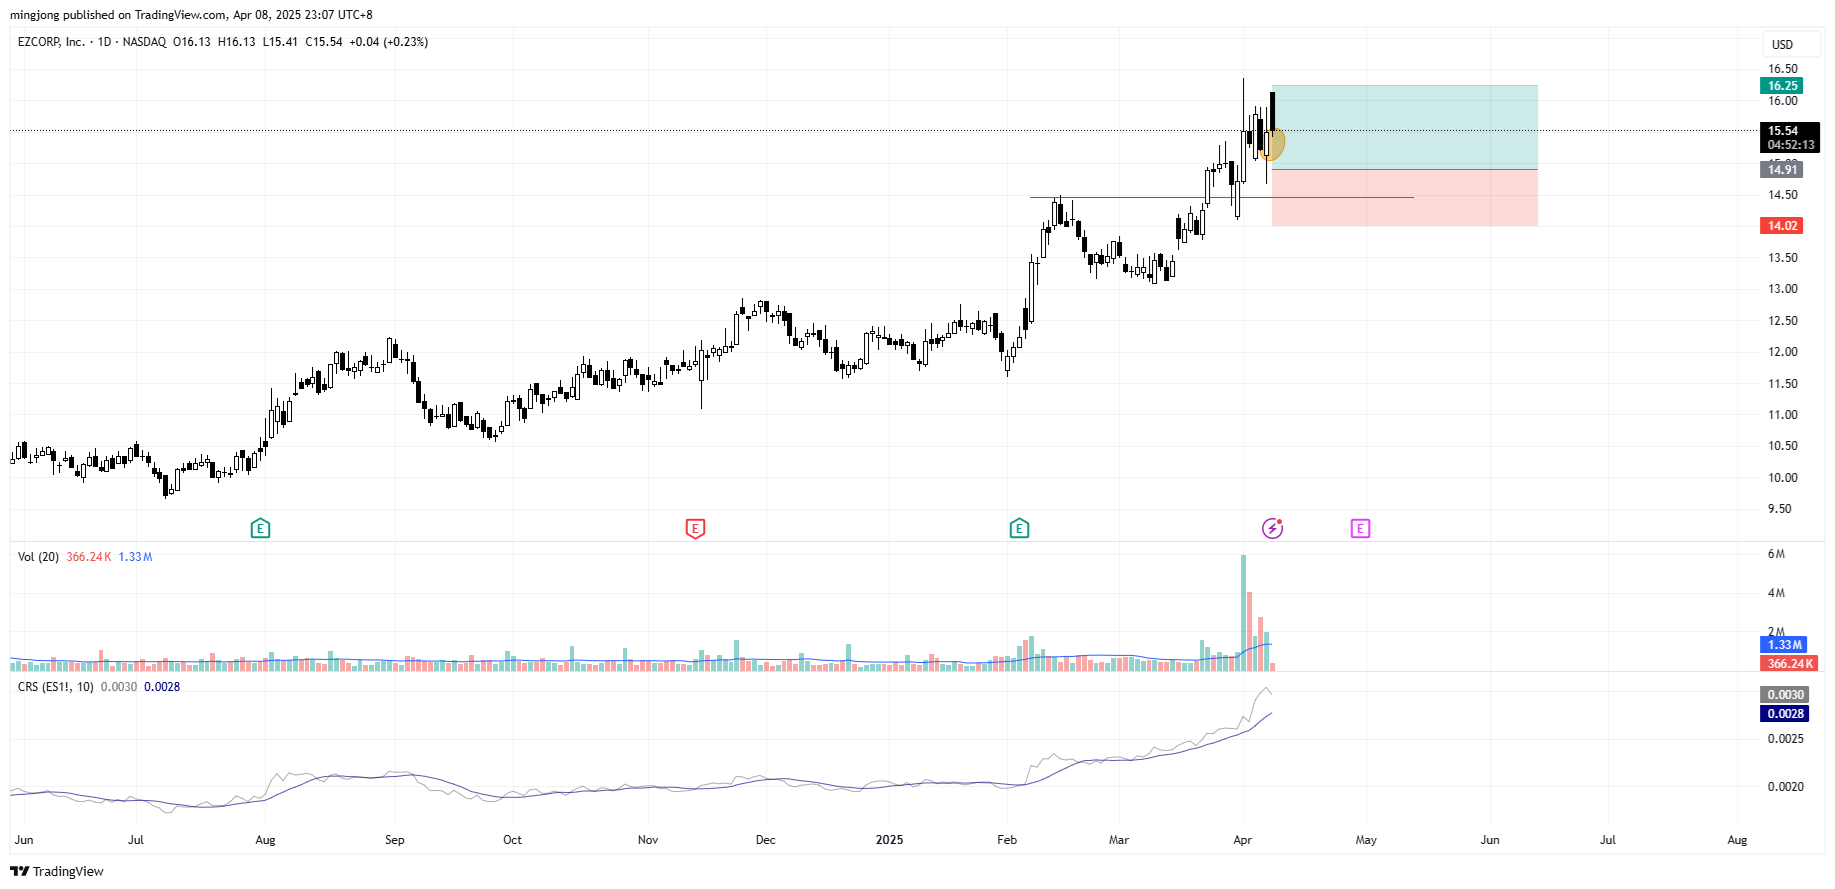
EZCORP (EZPW)
Author

Ming Jong Tey
Independent Analyst
Ming Jong Tey has been trading since 2008. He started his learning journey from technical analysis (indicators, Fibonacci, etc...) to value investing. Throughout his journey, he develops an interest in price action with chart pattern trading.


