The Boeing Company (BA) Elliott Wave technical analysis [Video]
![The Boeing Company (BA) Elliott Wave technical analysis [Video]](https://editorial.fxsstatic.com/images/i/General-Stocks_3_XtraLarge.png)
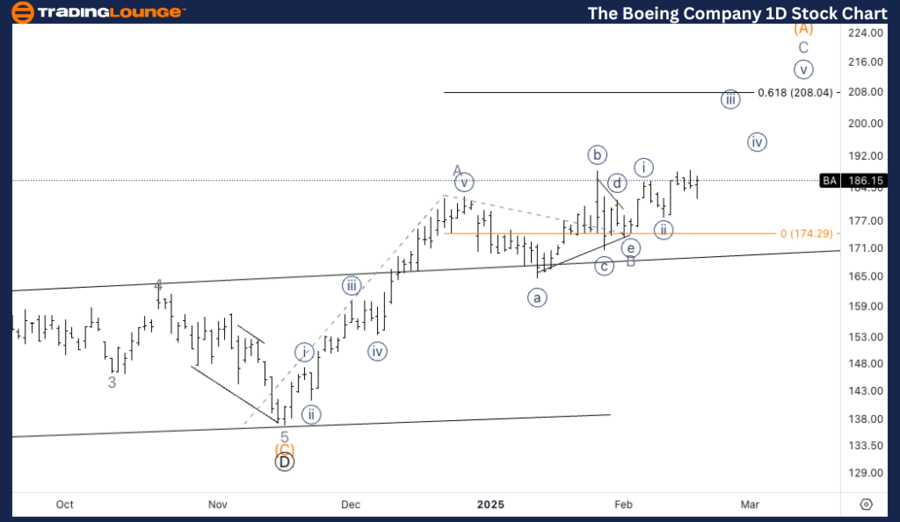
BA - Elliott Wave technical analysis (daily chart)
-
Function: Counter Trend.
-
Mode: Corrective.
-
Structure: Flat.
-
Position: Wave E of 4.
-
Direction: Upside in Wave E.
Details:
-
The larger structure follows a three-wave subdivision within Wave E of a higher-degree Wave B triangle.
-
Price remains contained within the triangle structure, but a breakout higher is expected in Wave E.
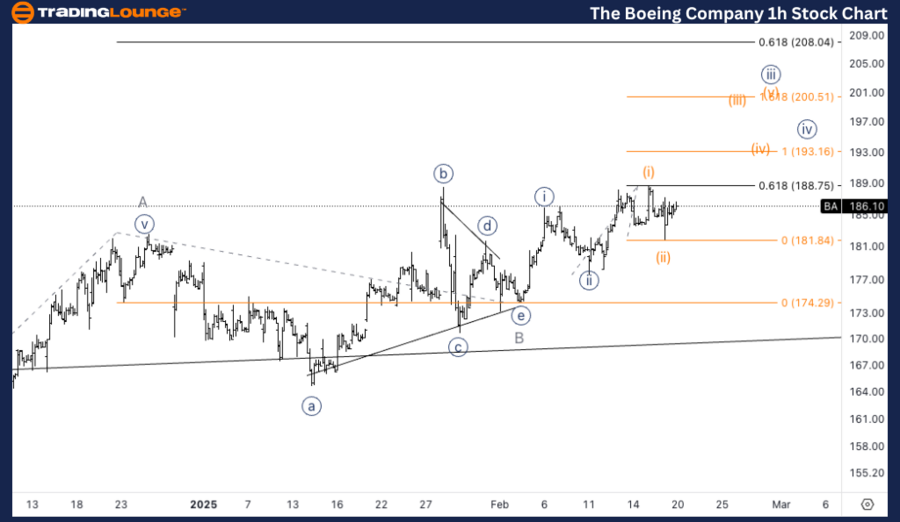
BA - Elliott Wave technical analysis (one-hour chart)
-
Function: Counter Trend.
-
Mode: Corrective.
-
Structure: Triangle.
-
Position: Wave C of (A).
-
Direction: Upside into Wave C.
Details:
-
Anticipating upside acceleration into Wave (iii) as the market extends in Minute Wave {iii}.
-
A 1.618 extension of Wave (iii) vs. (i) projects a target of $200.
Summary
This Elliott Wave analysis of The Boeing Company (BA) provides an overview of both the daily and 1-hour chart structures, outlining current trends and future price expectations.
- Daily Chart: BA is undergoing a flat correction within a larger triangle, currently positioned in Wave E of 4, with further upside expected.
- 1H Chart: The stock is moving through Wave C of (A), extending into Minute Wave {iii}, targeting $200 as the next resistance level.
The Boeing Company (BA) Elliott Wave technical analysis [Video]
Author

Peter Mathers
TradingLounge
Peter Mathers started actively trading in 1982. He began his career at Hoei and Shoin, a Japanese futures trading company.


