Tesla (TSLA) Stock Price and Forecast: Tesla struggles but oversold RSI may give upside
- Tesla shares fall yet again on Wednesday as Bitcoin investment hurts.
- TSLA sentiment worsens as RSI shows an oversold signal.
- TSLA shares have support at $539 as a pit stop.

Update May 20: Tesla shares gave up more ground on Wednesday as Bitcoin's crash splashed onto companies that own the cryptocurrency. Tesla has made a significant investment in Bitcoin, and it is unclear what its current position is. However, Bitcoin collapsing on Wednesday was certainly not good news for Tesla shares. The shares closed at $563.46 for a 2.5% loss. Tesla looks on course to test support at $539. A break of that level would see the consolidation region from September-November 2020 around $490-$420 as the next area of support.
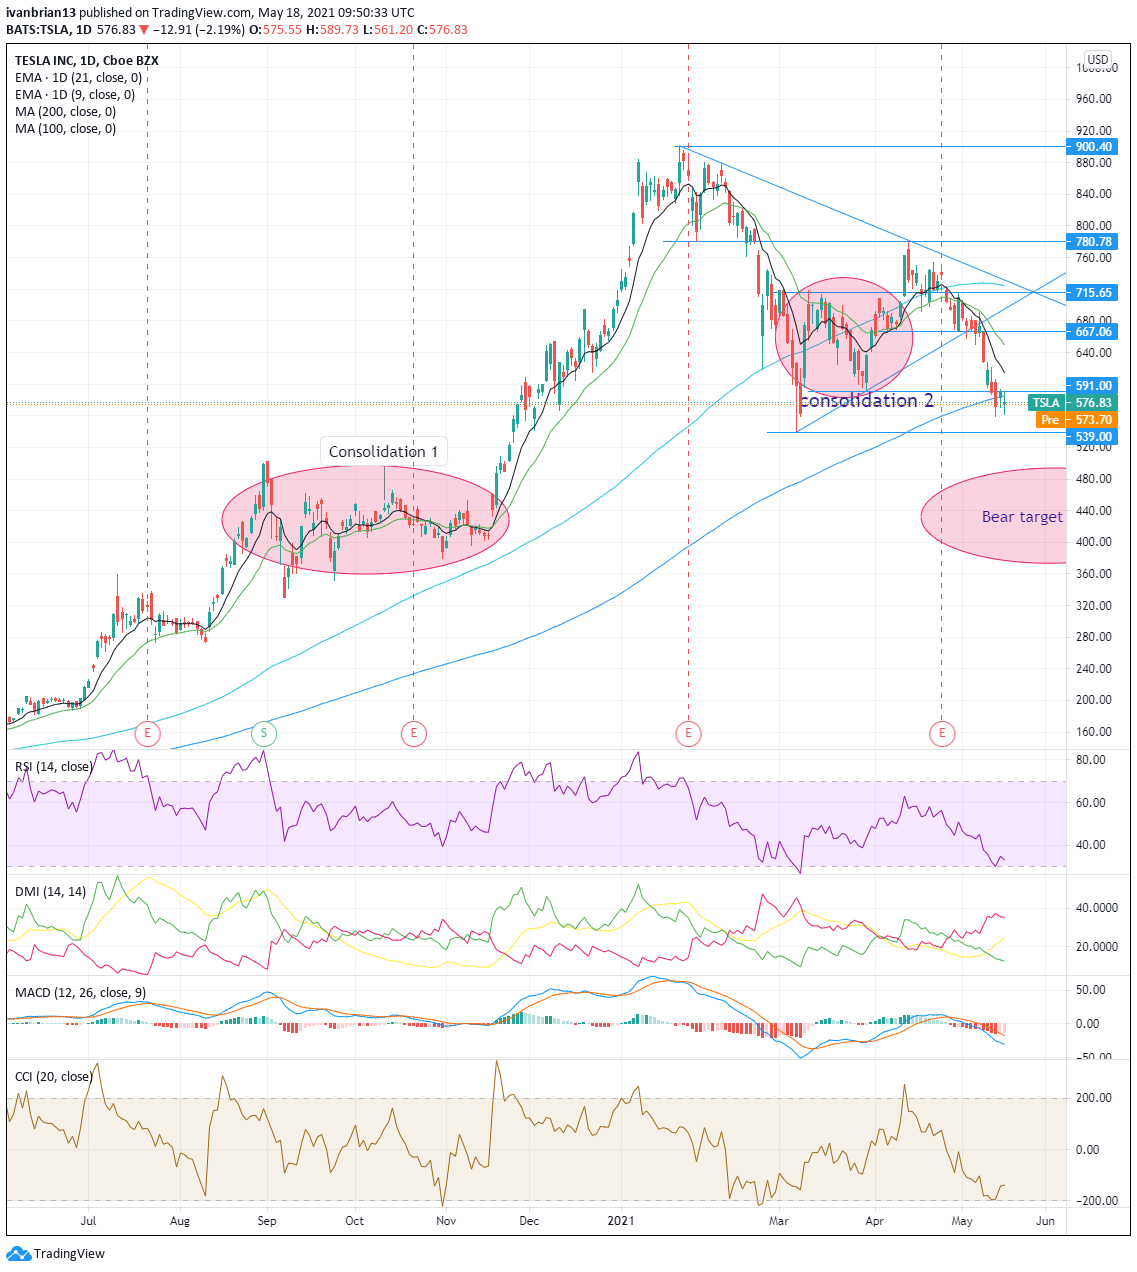
Another day, another sell-off for Tesla as the rough ride continues for the shares. Since peaking at $900 in late January, it has been a one-way street for Tesla and, unfortunately, it has been driving on the wrong side. The shares remain bearish on the chart and are on autopilot for sub-$500 territory. That is enough puns for now.
Tesla stock forecast
Tesla has been in a classic downtrend since late January with a series of lower highs and lows. The break of $780 in late February was what really ended any hope of bulls returning as that key support was broken.
Tesla then formed a triangle set up and breaking out to the downside is another classic bearish chart set up. The target of a triangle breakout is the size of the entry but this is not a particularly clean triangle, so there is uncertainty in the breakout range.
Other bearish factors though remain in play. Tesla broke the trendline support and targeted the 200-day moving average. This is a big and well-watched level for any financial market and it has helped to at least slow the fall in Tesla's share price.
The Moving Average Convergence Divergence (MACD) and Directional Movement Index (DMI) are both crossed into a bearish sign. The Relative Strength Index (RSI) and Commodity Channel Index (CCI) are both indicators showing overbought or oversold conditions. Both of these indicators flagged that Tesla was oversold on May 13. The RSI and CCI did not give strong signals as they barely crossed into oversold territory but this, combined with the 200-day moving average support, may have done enough to see some buyers step in and support the Tesla price. Friday saw a rally and bounce from this area but Tesla has not held those gains and dropped further on Monday.
As it stands, Tesla is at a key juncture. In Tuesday's premarket, Tesla has broken through the key 200-day moving average. The next level to target is $539, the low from early March. Once through there, Tesla will likely accelerate the move to sub-$500 levels. The reason for the acceleration is clearly evident in the lack of price discovery and time in the move from $440 to $540 on the way up. Tesla found little resistance through this area on the way up, so the same is likely on the way down.
There is a large consolidation area around the $440 level and this would be an area to initiate long positions as it should slow or halt any falls.
For Tesla to truly turn bullish, it needs to break the 9-day moving average resistance at $614. This will turn the short-term trend bullish, but not until a break of $667 would the bullish trend be firmly reestablished.
| Support | 539 | 500 | 465 | 440 | ||
| Resistance | 585 200-day | 591 | 667 bullish | 715 | 781 | 900 |
At the time of writing, the author has no position in any stock mentioned in this article and no business relationship with any company mentioned. The author has not received compensation for writing this article, other than from FXStreet.
This article is for information purposes only. The author and FXStreet are not registered investment advisors and nothing in this article is intended to be investment advice. It is important to perform your own research before making any investment and take independent advice from a registered investment advisor.
FXStreet and the author do not provide personalized recommendations. The author makes no representations as to accuracy, completeness, or the suitability of this information. FXStreet and the author will not be liable for any errors, omissions or any losses, injuries or damages arising from this information and its display or use. The author will not be held responsible for information that is found at the end of links posted on this page.
Errors and omissions excepted.
Premium
You have reached your limit of 3 free articles for this month.
Start your subscription and get access to all our original articles.
Author

Ivan Brian
FXStreet
Ivan Brian started his career with AIB Bank in corporate finance and then worked for seven years at Baxter. He started as a macro analyst before becoming Head of Research and then CFO.


