Technical analysis: Will the Toyota Motor stock price reverse its retreating?

Toyota Motor technical analysis summary
Below 149.24
Sell Stop
Above 159.43
Stop Loss
| Indicator | Signal |
| RSI | Neutral |
| MACD | Sell |
| Donchian Channel | Sell |
| MA(200) | Sell |
| Fractals | Sell |
| Parabolic SAR | Sell |
Toyota Motor chart analysis
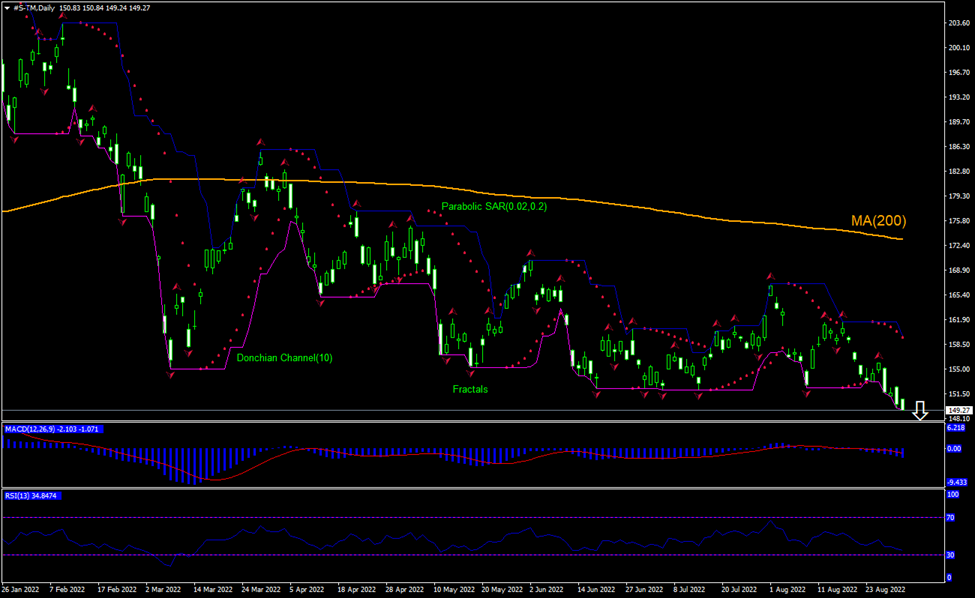
The technical analysis of the Toyota Motor stock price chart on daily timeframe shows #S-TM, Daily is falling after reverting back below the 200-day moving average MA(200) five months ago. We believe the bearish momentum will continue after the price breaches below the lower boundary of the Donchian channel at 149.24. This level can be used as an entry point for placing a pending order to sell. The stop loss can be placed above the upper boundary of the Donchian channel at 159.43. After placing the order, the stop loss is to be moved every day to the next fractal high, following Parabolic indicator signals. Thus, we are changing the expected profit/loss ratio to the breakeven point. If the price meets the stop loss level (159.43) without reaching the order (149.24), we recommend cancelling the order: the market has undergone internal changes which were not taken into account.
Fundamental analysis of stocks - Toyota Motor
Toyota Motor announced it would invest up to $5.27 billion (¥730 billion) in Japan and the United States to make batteries for electric vehicles. Will the Toyota Motor stock price reverse its retreating?
Toyota Motor Corporation on Wednesday said new investment in batteries production will increase output capacity by 40 gigawatt-hours when the additional facilities come on line between 2024 and 2026. About 400 billion yen will be invested in Japan, remaining 325 billion yen would be invested in Toyota Battery Manufacturing in North Carolina. Increased output expectations are bullish for a stock price.
Want to get more free analytics? Open Demo Account now to get daily news and analytical materials.
Want to get more free analytics? Open Demo Account now to get daily news and analytical materials.
Author

Dmitry Lukashov
IFC Markets
Dimtry Lukashov is the senior analyst of IFC Markets. He started his professional career in the financial market as a trader interested in stocks and obligations.


