|

Taiwan Semiconductor Manufacturing (TSM) new buying opportunity

The world’s largest dedicated semiconductor foundry Taiwan Semiconductor Manufacturing (NYSE: TSM) is down 25% from January peak. However, we’ll be looking at the Elliott Wave structure within the weekly daily cycles and we’ll explain why we believe it’s the right time to buy the stock.

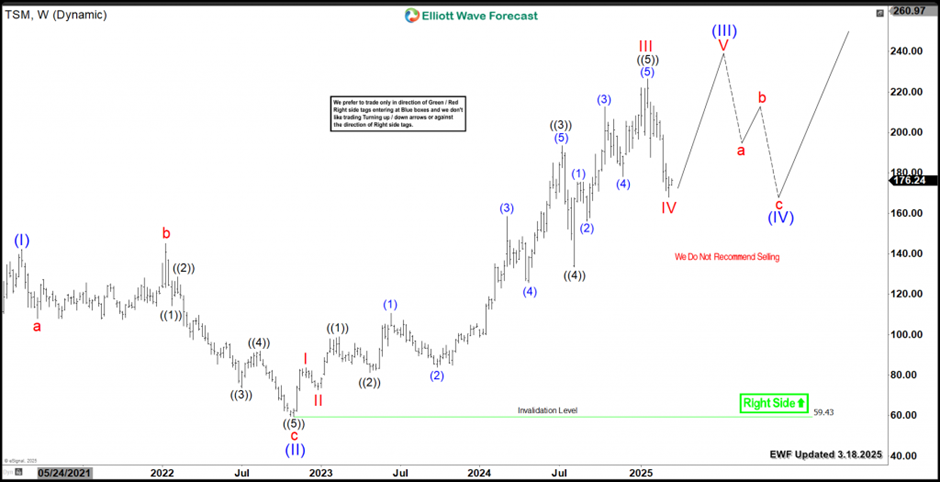
Looking at the weekly chart for TSM, It is showing an impulsive 3 waves move into new all-time highs. Wave I peak was in 2021 followed a 3 waves Flat structure in wave II ending in 2022. After that, the stock started the current rally in progress within wave (III) which is still looking for wave V before seeing a larger degree correction in wave (IV). Moreover, we consider the rally from all time lows as an incomplete bullish sequence missing 2 more swings before ending the entire cycle.

TSM weekly chart 3.18.2025

Chart

In the following daily chart, we see TSM decline from January 2025 peak unfolding within a corrective 3 waves ZigZag structure. That is to say, we expect the stock to find buyers in wave IV pullback in 3 , 7 or 11 swings. It already reached our buying Blue Box area at equal legs $176 – $152 and we the stock to react higher from there.

TSM will bounce from the mentioned area to start the rally in wave V and it will aim for a minimum target at $240 – $262. However if the stock fails to make new all time highs then it will correct lower within a double three structure.

TSM daily chart 3.18.2025

Chart

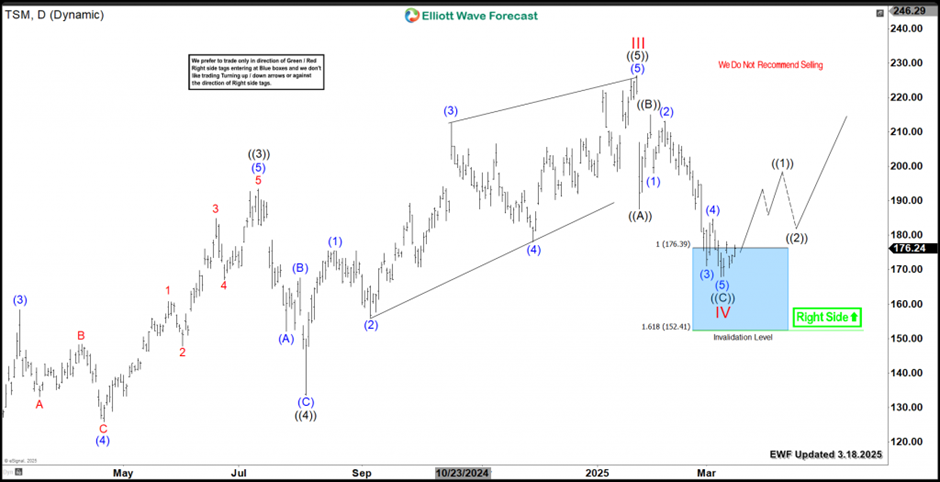
In conclusion, TSM weekly cycle is still bullish and consequently we favor buying the current daily correction within our Blue Box which is a High-frequency area where the market is likely to end cycles and make a turn.

Author

Elliott Wave Forecast Team

Elliott Wave Forecast Team

ElliottWave-Forecast.com

More from Elliott Wave Forecast Team
Share:

Editor's Picks

EUR/USD deflates to fresh lows, targets 1.1600

The selling pressure on EUR/USD now gathers extra pace, prompting the pair to hit fresh multi-week lows in the 1.1625-1.1620 band on Friday. The continuation of the downward bias comes in response to further gains in the US Dollar as market participants continue to assess the mixed release of US Nonfarm Payrolls in December.

GBP/USD breaks below 1.3400, challenges the 200-day SMA

GBP/USD remains under heavy fire and retreats for the fourth consecutive day on Friday. Indeed, Cable suffers the strong performance of the Greenback, intensified post-mixed NFP, and trades at shouting distance from its critical 200-day SMA near 1.3380.

Gold flirts with yearly tops around $4,500

Gold keeps its positive bias on Friday, adding to Thursday’s advance and challenging yearly highs in the $4,500 region per troy ounce. The risk-off sentiment favours the yellow metal despite the firmer tone in the Greenback and rising US Treasury yields.

Crypto Today: Bitcoin, Ethereum, XRP risk further decline as market fear persists amid slowing demand

Bitcoin holds $90,000 but stays below the 50-day EMA as institutional demand wanes. Ethereum steadies above $3,000 but remains structurally weak due to ETF outflows. XRP ETFs resume inflows, but the price struggles to gain ground above key support.

Week ahead – US CPI might challenge the geopolitics-boosted Dollar

Geopolitics may try to steal the limelight from US data. A possible US Supreme Court ruling on tariffs could dictate market movements. A crammed data calendar next week, US CPI comes on Tuesday; Fedspeak to intensify.

XRP trades under pressure amid weak retail demand

XRP presses down on the 50-day EMA support as risk-averse sentiment spreads despite a positive start to 2026. XRP faces declining retail demand, as reflected in futures Open Interest, which has fallen to $4.15 billion.