Swiss Market Index Elliott Wave technical analysis [Video]
![Swiss Market Index Elliott Wave technical analysis [Video]](https://editorial.fxstreet.com/images/Markets/Equities/FTSE/ftse-100-index-17327640_XtraLarge.jpg)
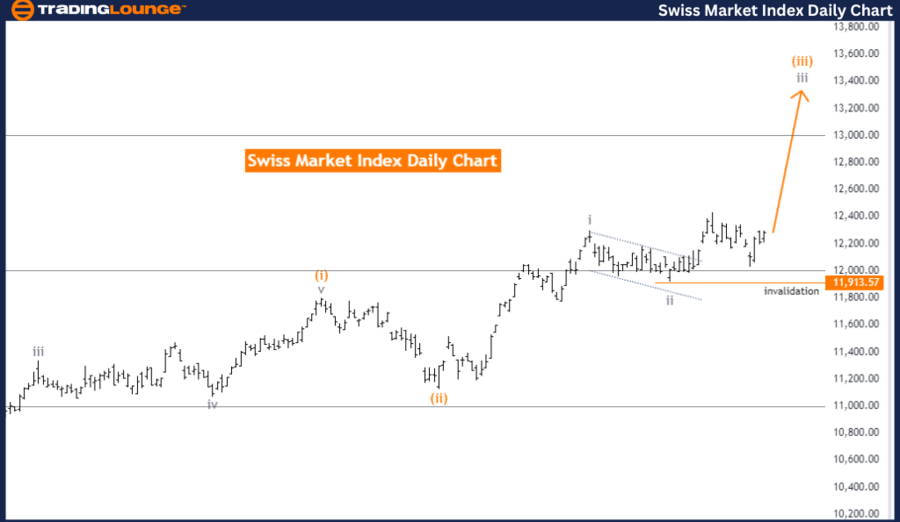
Swiss Market Index Elliott Wave Analysis Trading Lounge Day Chart.
Swiss Market Index Elliott Wave technical analysis
Function: Trend.
Mode: Impulsive.
Structure: Gray wave 3.
Position: Orange wave 3.
Direction next lower degrees: Gray wave 4.
Details: The completion of gray wave 2 within orange wave 3 suggests that gray wave 3 is now in progress. Wave Cancel Invalid Level: 11913.57.
The Elliott Wave Analysis of the Swiss Market Index on the daily chart demonstrates that the index is currently trending in an impulsive mode. The structure being analyzed is gray wave 3, which falls within the larger orange wave 3. This configuration indicates a strong upward movement, characterized by impulsive price actions.
The analysis points out that gray wave 2 of orange wave 3 has likely reached completion. This indicates that the corrective phase marked by gray wave 2 has concluded, and the market is now moving into the more dynamic gray wave 3, still within the overarching orange wave 3. This transition suggests a continuation of the upward trend, with expectations of increased market momentum.
The next lower degree direction is identified as gray wave 4. Upon the completion of the ongoing gray wave 3, a corrective phase, marked as gray wave 4, is anticipated. This phase may involve a short-term retracement or consolidation before the market resumes its primary upward trend. The appearance of gray wave 4 suggests potential short-term fluctuations before the index continues its overall upward movement.
The wave cancel invalid level is established at 11913.57. This level serves as a crucial point for validating the current wave analysis. If the Swiss Market Index drops below this threshold, the existing wave count would be invalidated, necessitating a reassessment of the wave count and the overall market outlook.
In summary, the Swiss Market Index Elliott Wave Analysis on the daily chart suggests that the index is in an impulsive upward trend within gray wave 3, which is part of orange wave 3. The analysis indicates that gray wave 2 has been completed, and gray wave 3 is currently underway, with gray wave 4 expected to follow. The critical wave cancel invalid level of 11913.57 must be monitored closely, as a breach would invalidate the current wave structure, prompting a reassessment.
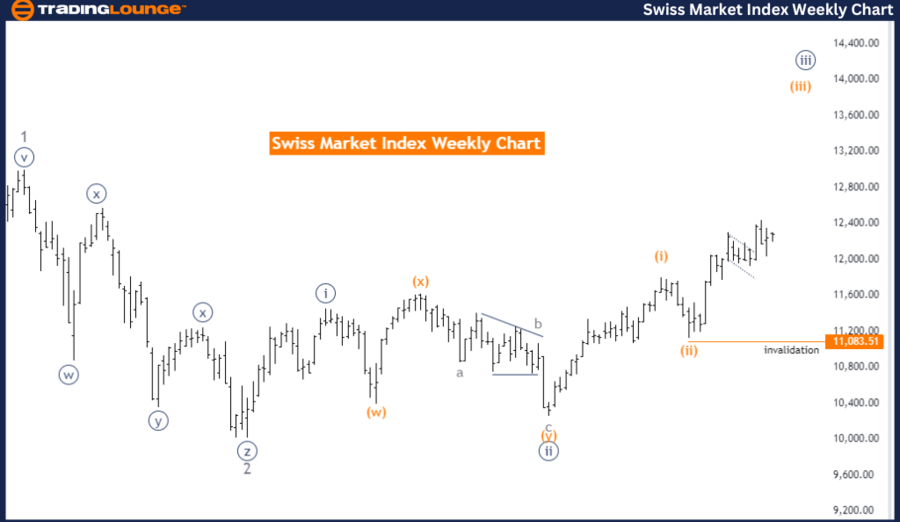
Swiss Market Index Elliott Wave Analysis Trading Lounge Weekly Chart.
Swiss Market Index Elliott Wave technical analysis
Function: Trend.
Mode: Impulsive.
Structure: Orange wave 3.
Position: Navy Blue Wave 3.
Direction next lower degrees: Orange wave 4.
Details: The completion of orange wave 2 within orange wave 3 suggests that orange wave 3 is currently active.
Wave cancel invalid level: 11083.51.
The Elliott Wave Analysis of the Swiss Market Index on the weekly chart reveals a trending function in an impulsive mode. The current structure is identified as orange wave 3, which is situated within the larger navy blue wave 3. This analysis indicates a strong upward momentum in the market, characterized by significant price movements.
The technical analysis suggests that orange wave 2 of orange wave 3 has been completed. This completion indicates that the corrective phase marked by orange wave 2 has concluded, and the market is transitioning into the more dynamic orange wave 3, still within the broader navy blue wave 3. This transition signifies a continuation of the upward trend, with expectations of increased market activity and potential price gains.
The direction for the next lower degrees is identified as orange wave 4. After the completion of the ongoing orange wave 3, a corrective phase marked by orange wave 4 is anticipated. This phase may involve a temporary pullback or consolidation before the market resumes its primary upward movement. The presence of orange wave 4 indicates that the market may experience short-term fluctuations before continuing its overall upward trend.
The wave cancel invalid level is established at 11083.51. This level serves as a critical threshold for the current wave analysis. If the Swiss Market Index falls below this level, the current wave count would be invalidated. Such a scenario would imply that the expected wave pattern is no longer applicable, necessitating a reevaluation of the wave count and market outlook.
In summary, the Swiss Market Index Elliott Wave Analysis on the weekly chart shows that the index is in an impulsive upward trend within orange wave 3, positioned in navy blue wave 3. The analysis suggests that orange wave 2 has been completed, and orange wave 3 is now active, with orange wave 4 expected to follow. The critical wave cancel invalid level of 11083.51 must be monitored closely, as a breach would invalidate the current wave structure, prompting a reassessment.
Swiss market index Elliott Wave technical analysis [Video]
Author

Peter Mathers
TradingLounge
Peter Mathers started actively trading in 1982. He began his career at Hoei and Shoin, a Japanese futures trading company.


